For most regional mobility operators, the signal that the operation is going well is that weekly trips keep climbing. That indicator isn't wrong — trip growth is necessary — but it's insufficient to know whether the operation is financially viable in its current configuration. An operator can grow from 200 to 800 weekly trips in four months and discover in month five that per-trip margin never exceeded $0.40 USD, that the cost of acquiring each new passenger consumed the first month of their rides, and that driver active-hour earnings sit below the retention threshold. Trip growth diagnoses none of those three problems. Unit economics do.
This article is for operators between three and eighteen months in who want to build a real viability model, or who are evaluating a launch and need to know which numbers to validate before committing time and capital. The central point isn't reaching perfect unit economics from day one — that doesn't happen in any mobility operation — but understanding the five numbers that tell you whether the direction is right and when you can expect to cross the sustainability threshold.
Large platform benchmarks don't apply to your operation
The unit economics narrative that circulates in mobility startup coverage is built on scale operations: Uber or DiDi in markets with millions of monthly trips, where the marginal cost of each additional trip approaches zero because infrastructure has been amortized for years. The numbers cited in that context — net revenue per trip of $1.50 to $2.80 USD, 60% driver retention at 12 months, passenger CAC of $4 to $8 USD — don't transfer directly to a 80-to-300-driver operation in a city of 150,000 to 500,000 residents.
In secondary LATAM markets, trips are shorter (8 to 14 km on average versus 14 to 22 km in large cities), fares are lower (average ticket of $2.50 to $5 USD versus $6 to $12 USD in capital cities), and the support cost per driver is proportionally higher because volume doesn't amortize it. Those structural differences produce unit economics with a different signature: tighter gross margin per trip, but also a more contained platform and support cost structure. Viability doesn't come from imitating the big platforms — it comes from understanding your own numbers and knowing when they become sustainable at the volume your market can deliver.
The five numbers that define whether a trip is profitable
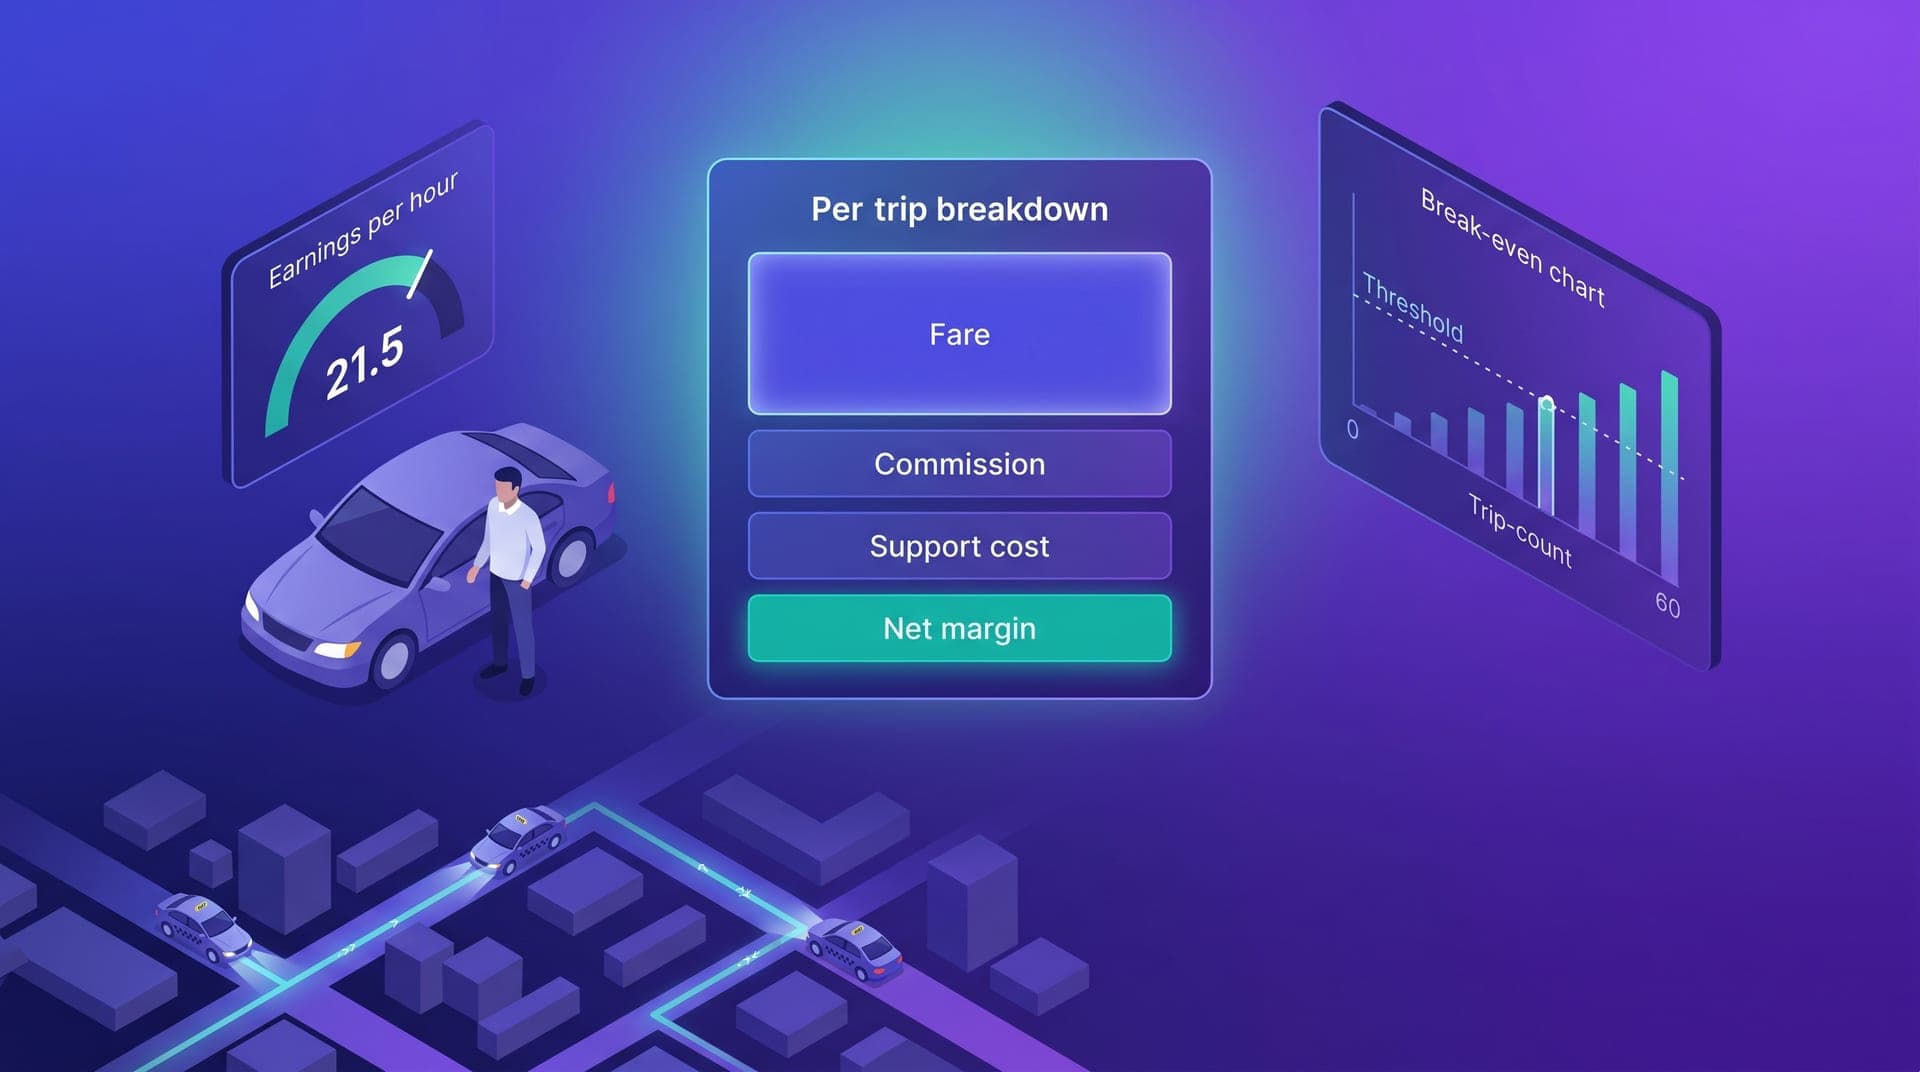
Unit economics analysis at the trip level starts with five variables. First, gross trip revenue: what the passenger pays, before anything is deducted. Second, platform commission: the percentage of gross revenue the operator retains before any costs — between 15% and 22% in affiliate models, between 55% and 75% in owned-fleet models. Third, payment processing cost: between 1.5% and 3.5% of gross revenue depending on payment method. Fourth, support cost per trip: total support spend for the period divided by the number of trips. Fifth, incentive cost per trip: bonuses and surge costs divided by total trips in the same period.
Per-trip margin is retained commission minus processing, support, and incentives. In a mature hybrid-model operation in a secondary LATAM market, that number typically sits between $0.35 and $0.85 USD per trip. In the first six months with affiliates and still-high support costs, it can be between $0.10 and $0.30 USD. Those ranges don't indicate the operation is unviable — they indicate how many monthly trips it needs to cover the fixed cost structure sitting above that margin.
Variables that reduce per-trip margin more than the operator expects:
- Poorly calibrated driver incentives: a $0.50 per-driver bonus applied to all weekly trips has the same margin impact as a 3% platform cost increase, but is booked as marketing rather than as a per-trip cost
- High cancellation rate: every trip cancelled after driver assignment consumes driver time and generates support costs without producing revenue, diluting the average margin across all completed trips
- Refunds without a clear policy: a complaint rate of 4% to 6% of trips without defined refund criteria can consume 8% to 12% of monthly net margin
- Undistributed support cost: if the operator spends two hours daily on incident handling without assigning that time as a cost, real per-trip margin is being systematically overstated
- Referral incentives without a retention floor: discounts on first trips from referred passengers who abandon after their second trip don't recover the effective acquisition cost
Driver active-hour earnings: the metric that predicts retention
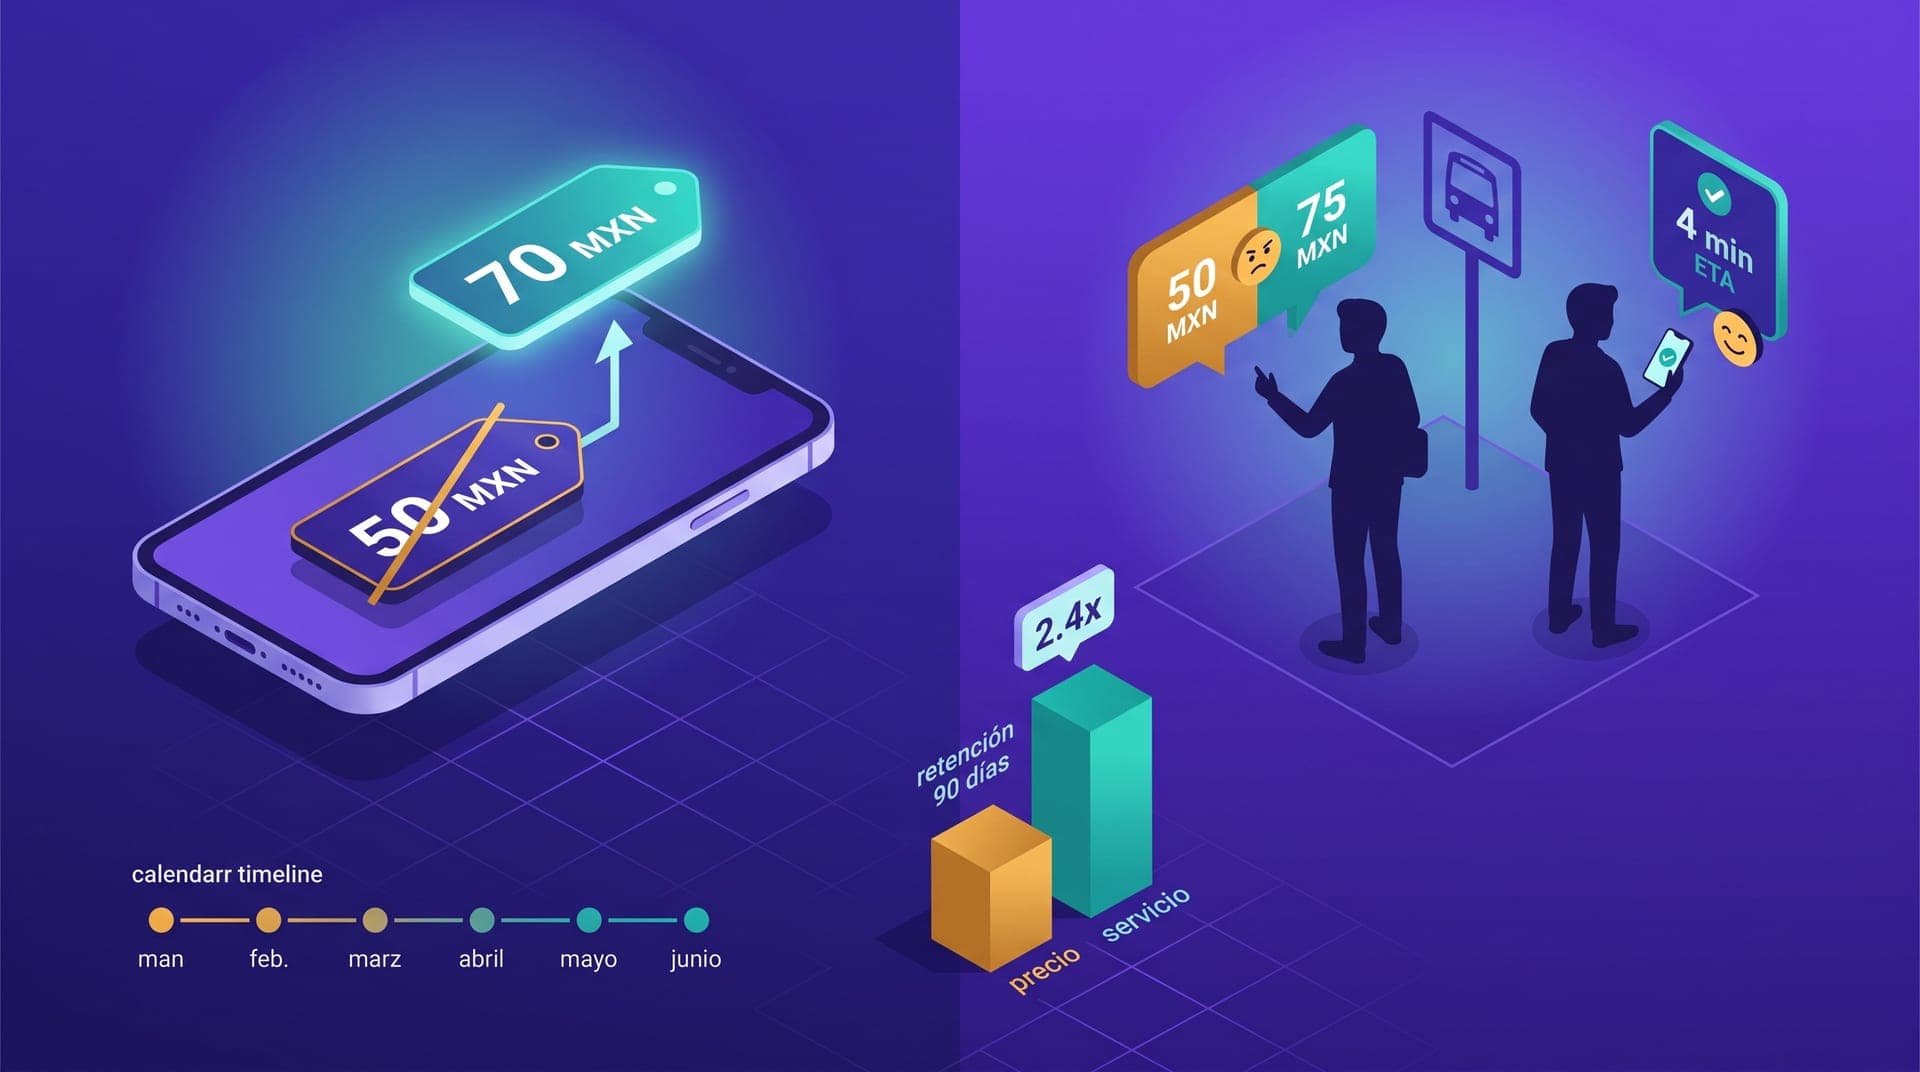
Per-trip margin is the operator's metric. But there is an equally critical number that belongs to the driver: active-hour earnings. This figure determines whether drivers will stay on the platform, whether they'll work peak hours or only low-demand windows, and whether they'll prioritize the platform over competitors when connected to multiple apps simultaneously. In secondary LATAM markets, the active-hour earnings that allow retaining drivers without permanent supplemental incentives range from $2.50 to $5.50 USD, depending on local fuel costs, the market's average ticket, and trip density per hour.
Below $2.00 USD per active hour, drivers optimize by reducing availability during low-demand windows, connecting only when surge is active, and progressively seeking alternative income. Above $4.50 USD consistently, the platform retains drivers without permanent loyalty bonuses. The most common operational error isn't that active-hour earnings are low at the start — that's expected — but that the operator doesn't monitor the metric and discovers mass driver disconnection months later, when it's hard to tell whether the cause was the fare structure, trip density, or competition.
CAC and LTV in a market of 200,000 residents
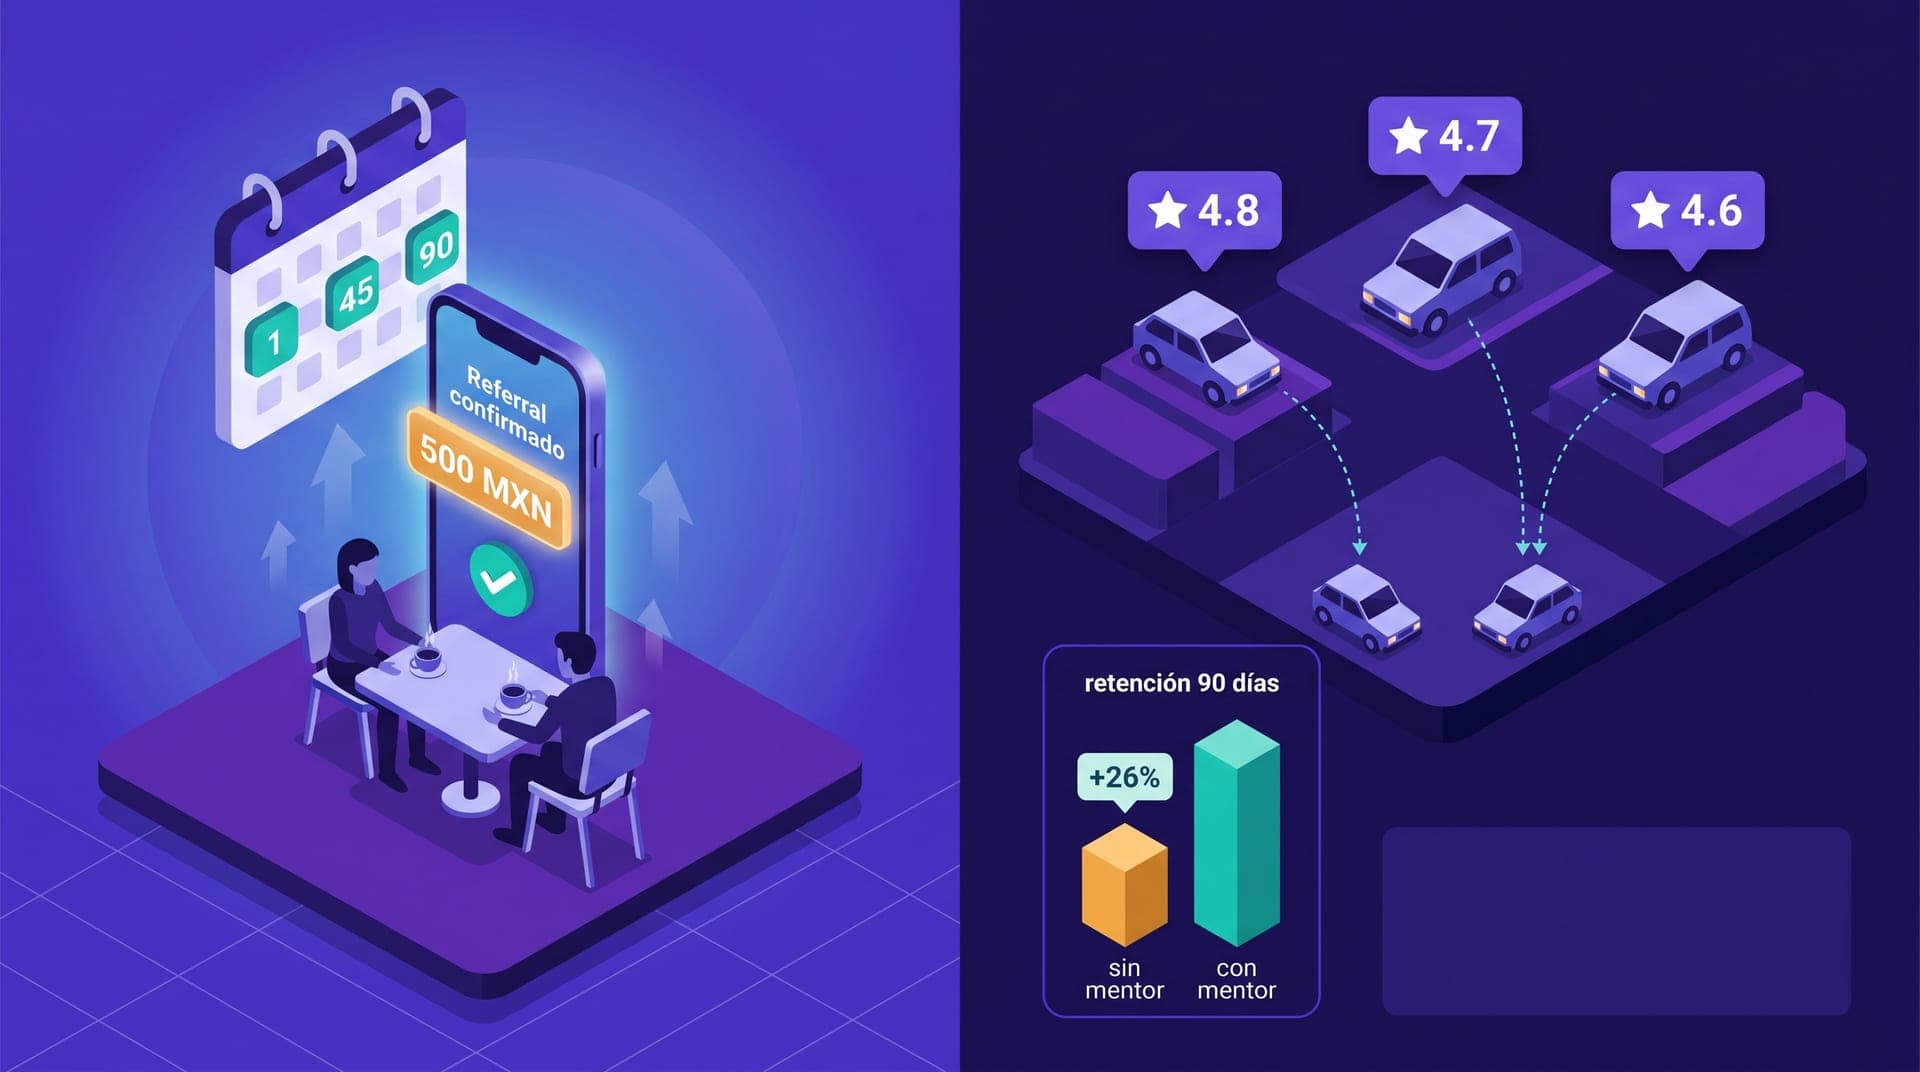
Customer Acquisition Cost and Customer Lifetime Value have different dynamics in secondary markets. In large cities with high digital density, CAC can stay low through mass-reach digital marketing. In a city of 200,000 residents, contact networks are denser and referrals operate with more intensity — which can push CAC lower in absolute terms — but LTV is also different: in markets with fewer alternatives for a satisfied passenger, repeat rates tend to be higher than in cities where four active mobility apps compete for the same user.
A recurring passenger in a regional LATAM operation takes 4 to 10 trips per month at an average ticket of $3 to $4.50 USD. If six-month retention is between 55% and 65%, that passenger's 12-month LTV represents $180 to $430 USD in gross revenue — of which the operator captures between 15% and 22% in an affiliate model, or 55% to 70% in an owned-fleet model. Against that LTV, a CAC of $8 to $18 USD is entirely sustainable. The most common error is not calculating LTV and assuming any acquisition spend is excessive, which leads operations to grow exclusively through referral and never activate the marketing channel that could accelerate passenger critical mass in the first six months.
Operation break-even: how many daily trips to cover fixed costs
The fixed cost structure of a regional operation includes the technology platform fee, support and operations cost, recurring marketing spend, and owned-fleet costs where applicable. The operational break-even is the daily trip volume that covers those fixed costs at the current period's per-trip margin. For a typical affiliate-model operation with platform costs of $600 to $1,200 USD per month, support handled by the operator, and a per-trip margin of $0.40 USD, break-even falls between 50 and 100 daily trips — equivalent to 1,500 to 3,000 monthly trips.
The key is calculating that threshold before committing the budget for the following months — not discovering it after six months of making decisions without that context. The difference between reaching 1,800 monthly trips in month four versus month eight isn't only temporal — it's whether the operation crossed its operational break-even before or after startup costs run out. Operators who calculate this number before launch prioritize differently: driver activation investment, passenger acquisition channel, and incentive level all have a concrete reference against which to measure their return.
Fixed costs operators routinely underestimate when calculating break-even:
- The operator's time as a real cost: spending 30 hours weekly on the operation without assigning a cost to that time makes break-even artificially low and the operation appear more efficient than it is
- Regulatory licenses and renewals: municipal permits, driver documentation renewals, and commercial insurance have an annual cost that should be distributed monthly to reflect the real cost of each period
- Communication and support tools: messaging APIs, incident management systems, and any channel for communicating with drivers and passengers have costs that grow with fleet volume
- Map API and data access: geolocation, route calculation, and traffic data costs accumulate in the background and exceed free tiers faster than expected as the fleet grows
- Dispute contingency reserve: not maintaining a monthly reserve of 3% to 5% of gross revenue for refunds and unexpected disputes turns any atypical month into a liquidity problem
Signs that unit economics are improving before the margins confirm it
Young operations in secondary markets rarely reach positive margins before month six. But there are indicators that signal whether unit economics are moving in the right direction even when total numbers are still negative. First, a falling CAC month over month: if the cost of acquiring new passengers drops without reducing acquisition volume, the channel is maturing and referral is picking up part of the load. Second, rising driver active-hour earnings: if that number increases, drivers are becoming more efficient or trip density is improving — both signals that supply and demand are aligning better. Third, falling support cost per trip: as the platform matures and drivers and passengers understand how it works, incidents per trip decline and support costs shrink proportionally to volume.
Seven months in and I thought things were going well because weekly trips kept growing. When I calculated for the first time how much I was earning per trip, I realized I needed 80 daily trips just to cover my fixed costs. I was doing 45. That completely changed my priorities for the week.
Unit economics in a regional mobility operation don't need to be perfect in month one — no operation's are. But they do need to be known. An operator who knows their current per-trip margin is $0.38 USD and break-even is 70 daily trips has the information to decide: which lever to move first, which acquisition channel justifies the next dollar of investment, whether the current fleet model is compatible with the margins the operation needs to become sustainable. An operator who doesn't know those numbers makes the same decisions based on a general sense of whether things feel like they're going well or not.
Building a unit economics model doesn't require a financial analyst or a complex spreadsheet. It requires four data points from the last month's operation: total gross revenue, retained commission, number of trips, and fixed costs for the period. With those four numbers and thirty minutes, any operator can calculate per-trip margin, monthly break-even, and whether the current trajectory is moving toward or away from the sustainability threshold. That exercise, done in month three instead of month fifteen, changes the speed at which model errors are identified and corrected before they become expensive to reverse.