The operator who looks at their fleet's average rating and sees a 4.6 is not seeing a real quality metric — they are seeing a number that hides the variance. The driver with a deteriorating 4.2 average and the one with a stable 4.8 are both inside the same aggregate. Rating systems on most regional platforms produce data but rarely produce action: there is no defined threshold that triggers a conversation, no protocol for what that conversation looks like, and no way to distinguish between a genuine quality problem and a temporary situation. The result is that quality problems accumulate silently until clients complain, cancel, or stop using the service without saying why.
This article is for operators with 40 to 150 active drivers who have ratings in their platform but haven't built the process that makes those ratings useful. The thesis is not that ratings are a bad metric — it is that a rating without an intervention process is a surveillance tool, not a quality management one. Understanding what a rating actually measures, when it signals a genuine problem rather than statistical noise, and how to structure the conversation that turns that signal into improvement or a clean exit is what separates a fleet with stable quality from one where quality erodes slowly while the aggregate number stays acceptable.
What an average rating measures — and what it hides
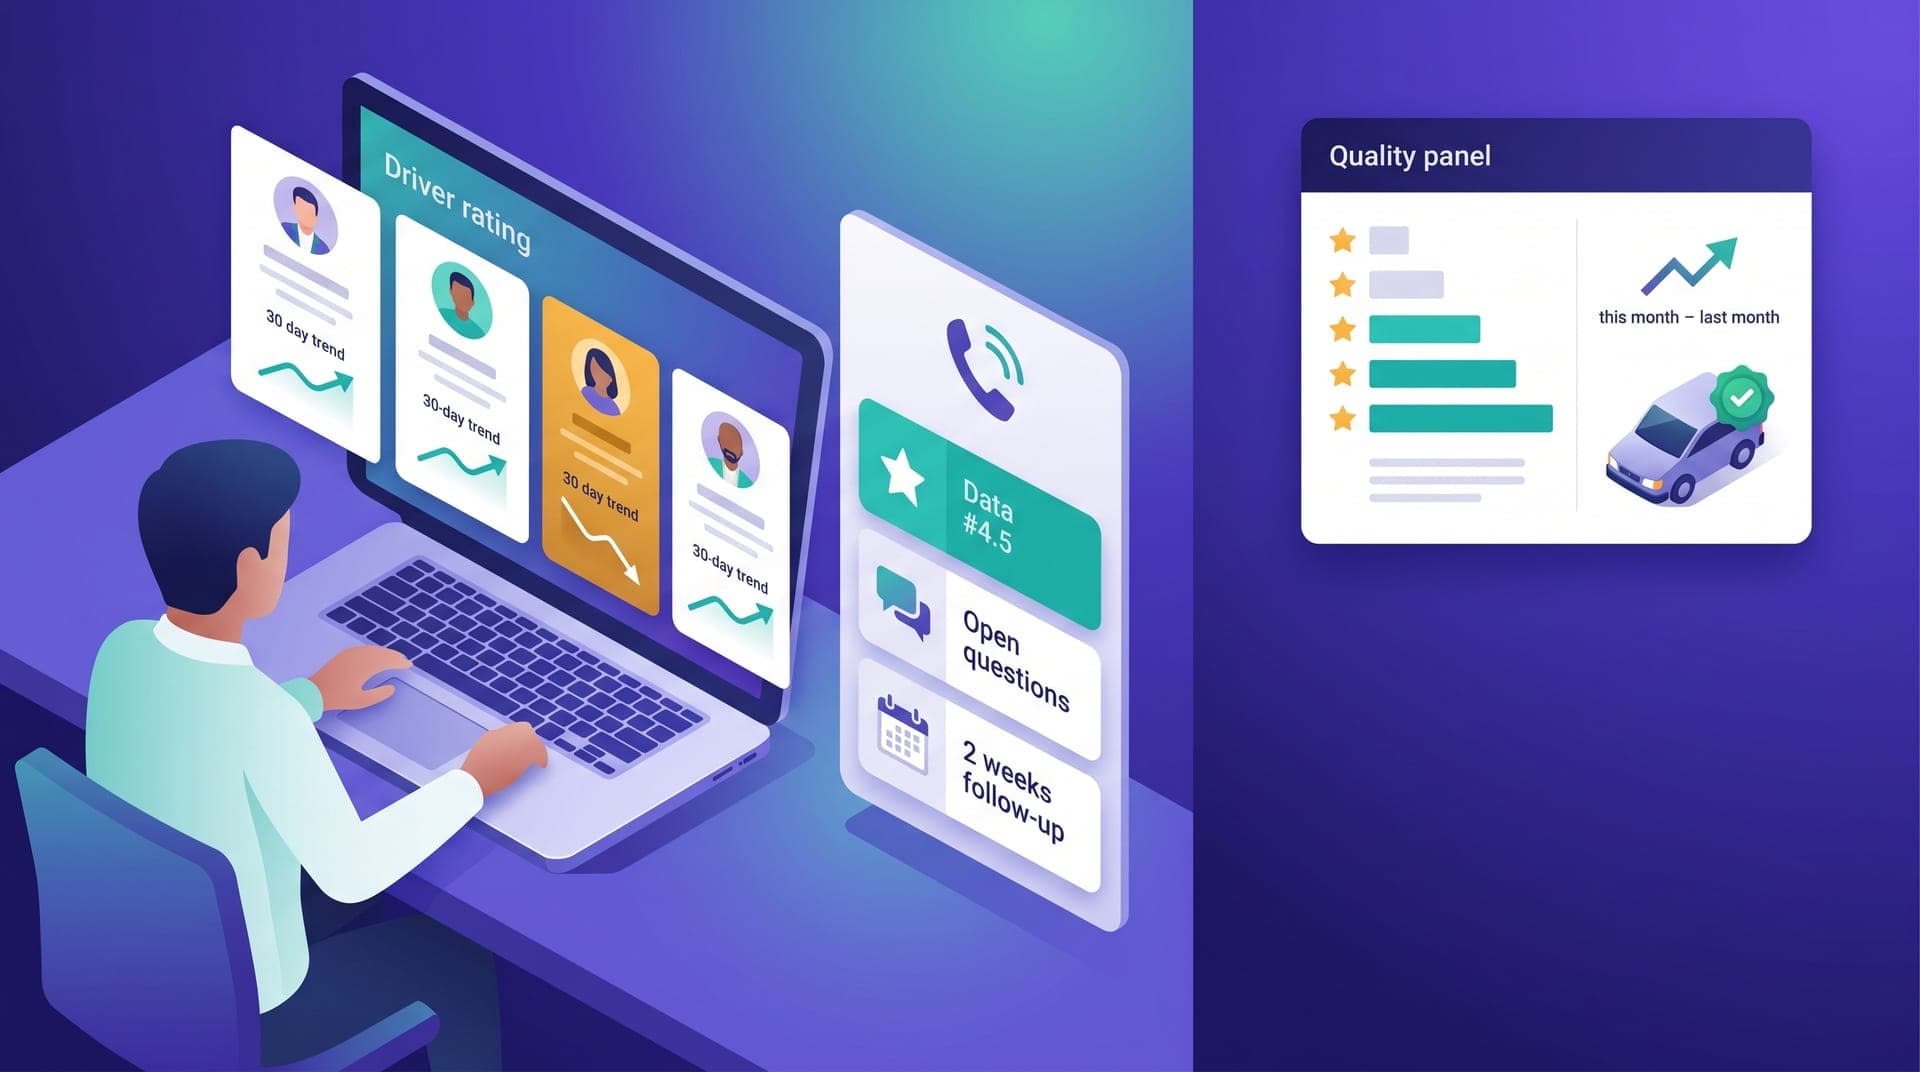
A 4.5 rating can come from a driver with 200 trips distributed around that value or from one with 80 trips — four weeks at 4.8 and two weeks at 3.9. Both produce the same number but represent completely different situations. The simple rolling average most dashboards show hides the trend: if the rating was 4.7 forty-five days ago and is 4.4 today, that is a deterioration signal the cumulative average won't detect until the decline has been running for months. The threshold that matters for quality management is not the average of all the driver's trips — it is the rating over the last 30 to 45 days compared to the prior period.
Ratings also measure different things depending on the type of passenger who leaves them. The corporate client who rates below 4 stars does so with specific criteria and rarely over price — that deviation carries more signal than the consumer passenger who gives 3 stars to a trip that arrived two minutes late in rush hour. The operator who consolidates everything into a single average loses the signal about which type of experience is degrading. Separating the rating by account type — consumer, corporate, institutional — reveals distinct patterns: there are drivers who perform well with consumer passengers and poorly with corporate clients, and that distinction shapes what conversation the operator has and with what focus.
The threshold and cadence: when to act and how often
The threshold that justifies a quality conversation is not what most operators intuit. Using 4.0 as the action point is too late: by the time a driver reaches 4.0, the deterioration has been running for weeks and has affected dozens of passengers. The threshold with the best practical results is 4.4 over the last 30 days when there are at least 20 trips in that period. Below 4.4, the probability that passengers prefer not to be assigned that driver again is high enough to make the intervention worth the time. Above that threshold with fewer than 20 trips, the number lacks sufficient statistical significance to act on.
Cadence matters too. Reviewing ratings once a month produces late responses in every case. The practice that works combines an automated weekly review for drivers below 4.4 in the last 30 days with a manual monthly review that includes the 45-day trend for the entire fleet. The goal is not to have more quality conversations — it is to have the right ones at the moment when they can still produce change, not after the deterioration has become chronic.
The intervention conversation: structure and goal
The most common mistake in a quality intervention conversation is framing it as a warning. A driver who perceives the conversation as a threat responds in one of two predictable ways: they defend their behavior or formally agree but change nothing. Neither produces sustained improvement. The conversation that works has a different frame: it is a review of what passengers are reporting, not an accusation. The coordinator who enters the call with the goal of understanding what is happening — not of communicating a sanction — produces conversations with a useful diagnosis and drivers with a genuine disposition to do something differently.
The structure has three parts. First, data without judgment: 'In the last four weeks your rating dropped from 4.7 to 4.3 across 28 trips — I wanted to talk through that with you.' Second, an open question before any interpretation: 'Do you know what might be behind it?' The most common causes that surface — personal circumstances, friction with difficult passengers, vehicle problems, discomfort with certain route types — are frequently actionable if the operator listens before intervening. Third, a specific agreement with follow-up: not 'let's improve' but 'in two weeks we will review together how the ratings are going.' The driver who knows there will be a second specific conversation has more reason to change something than one who receives a general conversation with no follow-up.
Operational causes of low ratings that are not attitude problems
A significant portion of rating problems in regional fleets does not originate in driver behavior — it originates in operational conditions the operator can modify. Treating both types of cause with the same protocol produces the wrong result: a driver with a low rating because they consistently operate in high-congestion zones where arrival times are unpredictable does not have an attitude problem to correct — they have an assignment that should be adjusted.
- High-congestion zones with unpredictable ETAs: drivers who operate where the estimated arrival time consistently differs from actual arrival accumulate low ratings for causes they cannot control. The solution is to adjust ETAs in those zones or redirect higher-rated drivers to those time windows during peak demand
- Vehicles with recurring mechanical issues: a rating drop in a driver who previously had high ratings can signal problems with the vehicle's condition. Passengers rarely mention it in text — they express it with stars. The quality conversation in this case should include a direct question about the vehicle's mechanical state
- Routes the driver doesn't know well: a driver new to airport runs or routes to industrial areas outside their usual territory may have rating dips due to unfamiliarity with the destination or passenger type. The solution is not a quality intervention — it is specific orientation before assigning that trip type again
- Shifts outside the driver's natural rhythm: drivers who cover night shifts for income reasons have different performance from their daytime shifts. That difference appears in nighttime ratings without the driver consciously noticing it
How a feedback loop improves the fleet without increasing turnover
The paradox of quality management in regional fleets is that the driver who most needs intervention is also the one at highest risk of leaving if that intervention is perceived as pressure. The driver with a deteriorating rating rarely sees it with the same clarity as the operator: they don't see their own trends, don't have access to an analysis of their recent trips, and generally interpret a quality conversation as the start of an exit process. The feedback loop that improves the fleet without increasing turnover inverts that pattern: it makes quality conversations something that happens regularly with all active drivers, not only when there is a problem.
A monthly rating review sent to all active drivers — 'last month you completed X trips with an average rating of Y, here are the written comments your passengers left' — makes the quality conversation part of the operation's normal rhythm, not a warning signal. The driver who consistently receives that review when they are at 4.8 does not perceive it as a threat when they receive it at 4.4. That reduces defensiveness in the intervention conversation and increases the probability that the driver processes the data as useful information rather than as a veiled warning.
For two years I ignored ratings below 4.3 because I didn't know what to do with them. When we built a protocol — 4.4 in 30 days triggers a call, the coordinator has a specific script, and we follow up in two weeks — the fleet's average rating went from 4.5 to 4.7 in four months. What surprised me most was that turnover dropped. The drivers who received the call said it was the first time someone on the team had explained in detail how they were doing. It wasn't pressure — it was information they didn't have.
What the quality dashboard should show — and almost none do
Rating dashboards on most regional platforms have two problems. The first is that they show historical averages rather than recent trends: seeing a driver's cumulative rating since they started operating says nothing about whether their quality is improving or deteriorating today. The second is that they don't show distribution: the driver with fifteen five-star trips and five two-star trips has the same 4.5 average as the one with twenty consistent 4.5-star trips, but the quality profile is completely different.
The dashboard that produces actionable information for quality management needs to show four things: the 30-day average rating with a trend comparison against the prior 30 days, the percentage of trips rated 1 to 3 stars in the last month, the list of drivers below the intervention threshold with the trip count backing that calculation, and the average rating broken down by passenger type when the operation has active corporate or institutional accounts. Those four views generate the conversations that matter rather than reactions to problems that have already escalated.
Quality management in a regional fleet is not a separate function from driver management — it is the same function with a different focus. The operator who treats ratings as monitoring data and the one who uses them as input for an active feedback loop are running the same platform with different outcomes six months from now. The difference is not in the rating system — it is in whether the operator built the process that turns each deterioration signal into a specific conversation, at the right moment, with the goal of improving rather than punishing.
In an operation of 80 to 120 drivers, the difference between a fleet with a 4.5 average rating and one with a 4.7 is not cosmetic — it is the difference between an operation that retains institutional clients and one that loses them without understanding why, between a fleet with manageable turnover and one that replaces 30 percent of its drivers each year without seeing quality improve. The investment to move that number is not more staff or a new system — it is building the intervention protocol that can already be run with the operations coordinator, with the data that already exists in the platform, and with the conversations that already happen but lack structure. What is missing is not the information — it is the process.