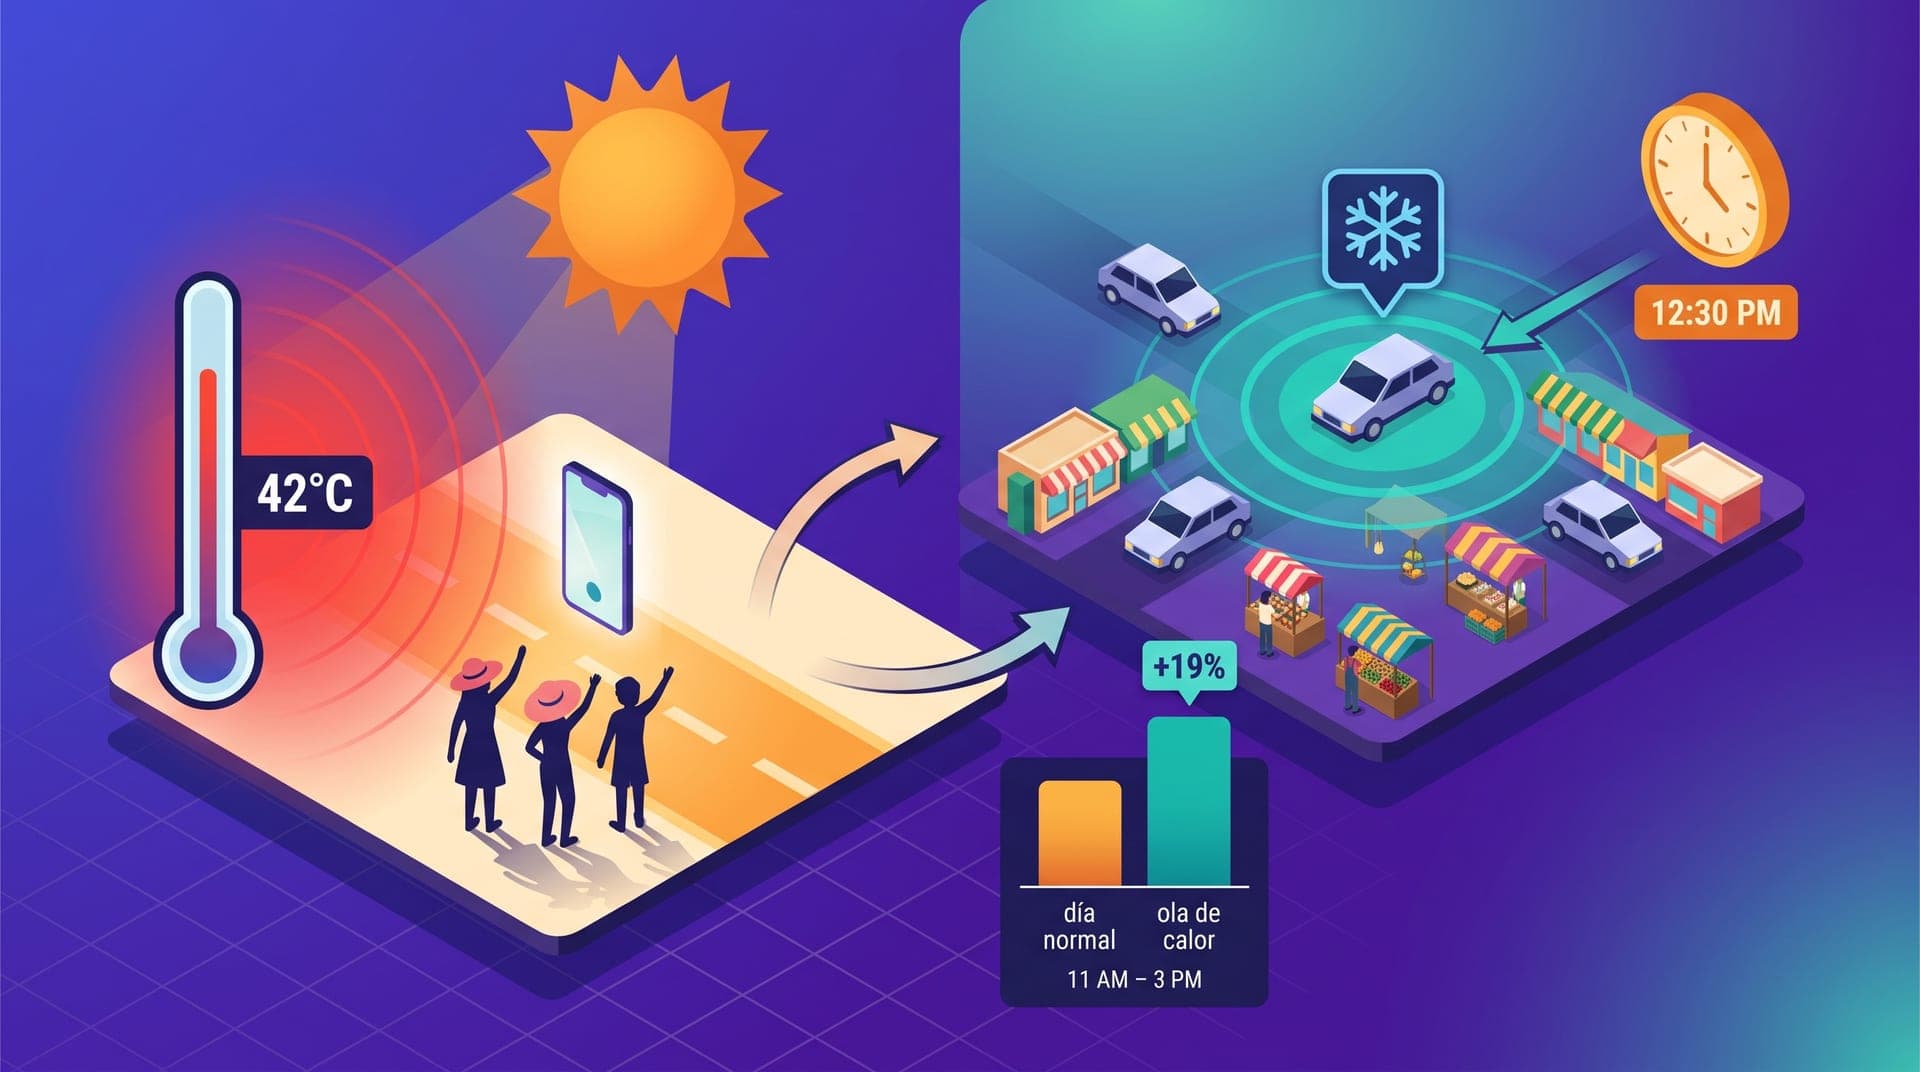
In LATAM cities where heat exceeds 38°C for days at a stretch, passenger behavior shifts in the same way it does during heavy rain: the 4-block walk stops being a reasonable option, and the ride-hailing platform moves from a discretionary service to the most practical alternative available. In Monterrey, Mérida, Hermosillo, Culiacán, San Salvador, and Guatemala City, a heat wave sustained for more than three days generates a demand uplift of 12 to 22% in the 11 AM to 3 PM blocks, concentrated in local commercial zones, municipal markets, and corridors without shade. The difference from rain is not the magnitude of the effect but its temporal structure: rain produces a 45-to-90-minute peak that vanishes when it clears, while a heat wave sustains that elevated demand level across the full midday stretch for several consecutive days. And almost no operator has a heat protocol.
This article is for operators with 15 to 60 active drivers in cities with a defined hot season — primarily northern and Pacific Mexico, the Yucatán Peninsula, and much of Central America — without a differentiated process for heat waves in their operational calendar. It covers why extreme heat generates marginal ride-hailing demand and how it differs structurally from rain; when the midday peak occurs and which zones concentrate it; how to position drivers during the least popular block of the day; what pricing adjustment works without creating the perception of price-gouging passengers who have few alternatives; and what agent query confirms whether the heat pattern exists in your historical operation. The thesis is direct: extreme heat is the second most important climate demand event in many LATAM markets, and the operator who has a rain protocol but no heat protocol is managing half the climate year correctly.
Why extreme heat generates ride-hailing demand: the mechanism that isn't obvious
To understand heat's impact on ride-hailing demand, you need to identify who would not use the platform on a regular day but does when temperatures hit 40°C. The typical passenger in a regional Mexican or Central American city makes utilitarian walks of 5 to 15 minutes to reach a market, a bus stop, a pharmacy, or their child's school. At 28 to 32°C with moderate humidity, that walk is uncomfortable but acceptable. At 40°C with 60 to 80% relative humidity — a common condition in Mérida or San Salvador from March through June — the same walk poses a real heat-stroke risk for elderly adults, children, and workers who have already spent hours in hot environments. The marginal passenger activated by a heat wave is the user who normally doesn't open the app because they'd rather walk: the market vendor finishing their shift at 2 PM, the parent picking up their child from school at noon, the elderly adult with a medical appointment, the informal worker operating in shadeless zones.
The mechanism is mode substitution: extreme heat raises the perceived cost of the free mode — walking — in a nonlinear way. Above 40°C, the economic savings of not taking a taxi no longer offset the risk of dehydration or heat exhaustion. That threshold varies by passenger profile, but in regional operations where shared taxis or urban buses are the alternatives, a heat wave redirects a fraction of those users toward private ride-hailing during peak solar hours. The quantitative difference from rain: the heat effect is more sustained — 3 to 7 days versus 1 to 2 hours — more predictable — temperature forecasts are accurate 3 to 5 days out — and more concentrated in a specific time block: peak solar hours from 11 AM to 3 PM, rather than distributed across the afternoon and evening like rain. The operator who understands this dynamic converts the weather forecast into an operational planning tool rather than a surprise to manage.
The midday block: the coverage gap heat waves always expose
The central operational problem of heat waves is not demand: it's supply. The 11 AM to 3 PM block is the least popular among drivers in any season, but during a heat wave it becomes the most punishing: the car accumulates heat while parked, fuel consumption rises from the air conditioning, traffic in commercial zones is denser, and the driver who works nights or early mornings is in their rest period. In cities where full-time drivers prioritize the 6 AM to 10 AM and 5 PM to 10 PM blocks, midday coverage is already 30 to 40% lower than the morning and evening peaks on normal days. During a heat wave, that coverage drops further: drivers who would normally work a few hours in that block reduce their active time because the heat increases fatigue, raises vehicle cooling costs, and extends wait times in shadeless zones. The result is a structural coverage gap: demand rises 12 to 22% in exactly the block where supply hits its daily minimum.
That gap has direct consequences for service quality: wait times that jump from the usual 3 to 5 minutes to 8 to 14 minutes during midday heat-wave blocks, with passenger cancellation rates rising proportionally. A passenger waiting more than 6 minutes under direct sun is significantly more likely to cancel than one waiting the same amount of time indoors. For an operator who didn't anticipate the weather event, the result is that the passenger's day of greatest need becomes the platform's worst service day. A passenger frustrated during a heat wave is considerably more likely to uninstall the app or permanently switch to an alternative than one who waited too long on a regular afternoon: the need was real, the service failed at the worst possible moment, and the memory of that experience forms under conditions of extreme discomfort.
The most affected zones: why the heat demand map differs from the rain map
The demand map during a heat wave differs from that of rain. Rain drives requests from leisure and evening entertainment zones — people want to go out, and the passenger heading to dinner or a bar is the most active during a rain night. Heat drives requests from zones of obligatory daytime activity: municipal markets where vendors and buyers must complete transactions regardless of the weather, public transit stops where users arrived on foot and can't bear the walk back, school pickup zones during the 12:30 PM to 1:30 PM dismissal windows, and commercial corridors with shadeless sidewalks. These zones are not the same ones the operator activates in their rain protocol, which typically focuses on restaurants, main plazas, and entertainment districts.
This difference has positioning implications the operator cannot ignore. An operator who activates the rain surcharge in leisure zones and applies the same map to the heat protocol will generate surplus coverage where there is no demand and a deficit where there is. The correct diagnostic requires identifying in historical operation which zones have the highest concentration of requests in the 11 AM to 3 PM block during the hottest days of the year, and comparing that map against the rain map. In most regional operations, the heat demand map has 2 to 4 primary high-density zones that don't overlap with the rain zones. Knowing them before the event — not during it — is the prerequisite for the positioning protocol to work.
Heat wave pricing: why 1.2x outperforms 1.35x and how to communicate it
Pricing adjustment during a heat wave has an operational component — attracting more drivers to the midday block — and a perception component the operator cannot ignore: the passenger requesting a ride in 40°C heat in a zone without accessible transit alternatives has less ability to decline the surcharge than the leisure passenger on a rainy night who can simply choose not to go out. In operations that applied a 1.35x to 1.45x surcharge during heat waves, pre-assignment passenger cancellations rose 18 to 25 percentage points above ordinary days — a signal that the passenger perceives the price as exploitative and chooses to find an alternative. With a 1.15x to 1.2x surcharge, pre-assignment cancellation is practically identical to an ordinary day and the request-to-completed-trip conversion holds. The moderate surcharge generates enough additional income for the midday-block driver to cover the extra AC fuel cost — roughly 12 to 20 MXN per 3-hour shift at 40°C — without building a reputation for price-gouging on the days when the passenger most depends on the platform.
The midday incentive: how to attract drivers to the hardest block of the year
The pricing surcharge activates the full-time driver who already works the midday block: they know each trip will yield 15 to 20% more than usual, and that calculation changes their decision to connect during those hours. For the part-time driver who works primarily in the afternoon or evening, the pricing surcharge alone is insufficient: the incremental per-trip adjustment doesn't compensate for the discomfort of working in the hottest block of the day, which historically also has the lowest request density precisely because drivers don't work it. The incentive that draws part-time drivers into the midday block during a heat wave has the same structure as the night-shift block bonus during quincena: a fixed block bonus for a minimum number of trips completed in that specific window. An incentive of 80 to 120 MXN for completing at least 3 trips in the 11 AM to 2 PM block activates drivers who would otherwise not work that slot. The distinction from a total-day trip bonus is critical: the driver who already works 8 hours a day doesn't need the midday incentive; the one who works 4 hours in the evening does, and the block bonus is the right signal for their profile.
The five elements of the heat protocol the operator can configure 48 hours before the heat wave begins:
- **Forecast check 48 hours in advance**: a projected maximum temperature of 38°C or above for two consecutive days activates the protocol. Don't wait for the heat to arrive — temperature forecasts have sufficient accuracy to plan with that margin.
- **Heat zone map separate from the rain map**: the pricing adjustment and positioning apply in municipal market zones, public transit stops, and school pickup corridors — not the same zones as the rain protocol.
- **Surcharge of 1.15x to 1.2x from 10:30 AM to 3 PM** in those zones only, not during the early morning or late afternoon and evening where the heat effect dissipates with the dropping sun.
- **Block incentive for part-time drivers**: 80 to 120 MXN for completing at least 3 trips in the 11 AM to 2 PM block during declared heat wave days.
- **Positioning message to drivers the prior evening**, with the expected highest-density zone for the midday block — municipal markets, bus stops, school zones — so they arrive directly without having to deduce it from the real-time map.
The agent query that confirms whether the heat pattern exists in your operation
Before designing a heat protocol, the operator should verify that the pattern exists in their specific market: not every city shows the same heat demand effect, and in markets where passengers have access to air-conditioned commercial spaces or where midday taxi use is already high, the incremental effect may be smaller. The agent query that produces that verification: 'For the last 24 months, identify the days where the maximum temperature in my city was at or above 38°C. Compare request volume in the 11 AM to 3 PM block on those days against volume in the same block on days in the same months where temperature was between 28 and 33°C. For each group, show average request volume, completion rate, average wait time, and the three zones with the highest request concentration in that block. If extreme heat days show request volume in that block more than 10% above the comparison group, the pattern exists in your operation and the protocol adjustment has measurable return.' This verification takes under 10 minutes and determines whether a heat protocol is relevant in your specific market before investing time in configuring one.
The complementary query that calibrates whether the coverage gap is the primary problem: 'For the extreme heat days identified in the previous query, show me the average wait time in the 11 AM to 3 PM block compared to the same block on normal days in the same period, and the number of requests that went unassigned in that block. If wait times on heat days exceed normal-day wait times in that block by more than 40%, the coverage gap — not pricing — is the primary problem to solve.' The two results together determine the protocol's priority order: if wait times don't rise significantly but request volume does, pricing adjustment is the lever. If wait times rise but volume is similar, coverage is the problem and the block incentive is the first action. If both rise, the complete protocol — pricing, incentive, and positioning — produces the greatest return.
After 16 months of operation in Hermosillo I had never tracked what happened during the May heat waves. My coordinator mentioned we were getting many complaints about long midday waits in those weeks. When I asked the agent to compare my days above 40°C against normal May days in the morning and midday blocks, I found that between 11 AM and 2 PM my request volume rose 17% but my driver coverage dropped 28% — part-time drivers simply weren't connecting. Average wait time in that block went from 5 minutes to 12. I activated a 90 MXN bonus for 3 trips in that block and sent the zone map — markets and schools — to my 11 full-time drivers on Wednesday night. By Thursday, the first day of the wave, midday wait time dropped to 7 minutes and unassigned requests fell to a third.
The heat protocol doesn't compete with the rain protocol: it complements it. Rain concentrates its effect between June and October across most of Mexico, while heat waves are most frequent from March through June — the pre-rain period — and in arid zones without a pronounced rainy season. An operator who builds their operation's weather calendar with both protocols has covered the two most frequent meteorological demand events in their market, which together can account for 20 to 40 days of elevated demand per year concentrated in specific blocks. Treating them as unexpected events when temperature and rain forecasts are accessible 48 to 72 hours in advance means leaving measurable value on the table on exactly the days when the service has the greatest impact on passenger perception.
The metrics that signal whether the heat protocol is working are the same as for any demand event: the completion rate in the midday block during heat waves compared to the same block on normal days in the month, and the average wait time in that block. A well-executed protocol produces a completion rate in the heat block equal to or above the ordinary-day rate — not below it — with wait times under 8 minutes in the identified high-density zones. If the completion rate drops during heat days, the problem is coverage and the block incentive is the first lever. If the completion rate holds but wait times rise, the problem is positioning: drivers are active but in the wrong zones. The agent query run at the end of each heat wave converts the event into a calibration diagnostic that improves the next protocol, rather than an operational period that is simply endured until temperatures drop.