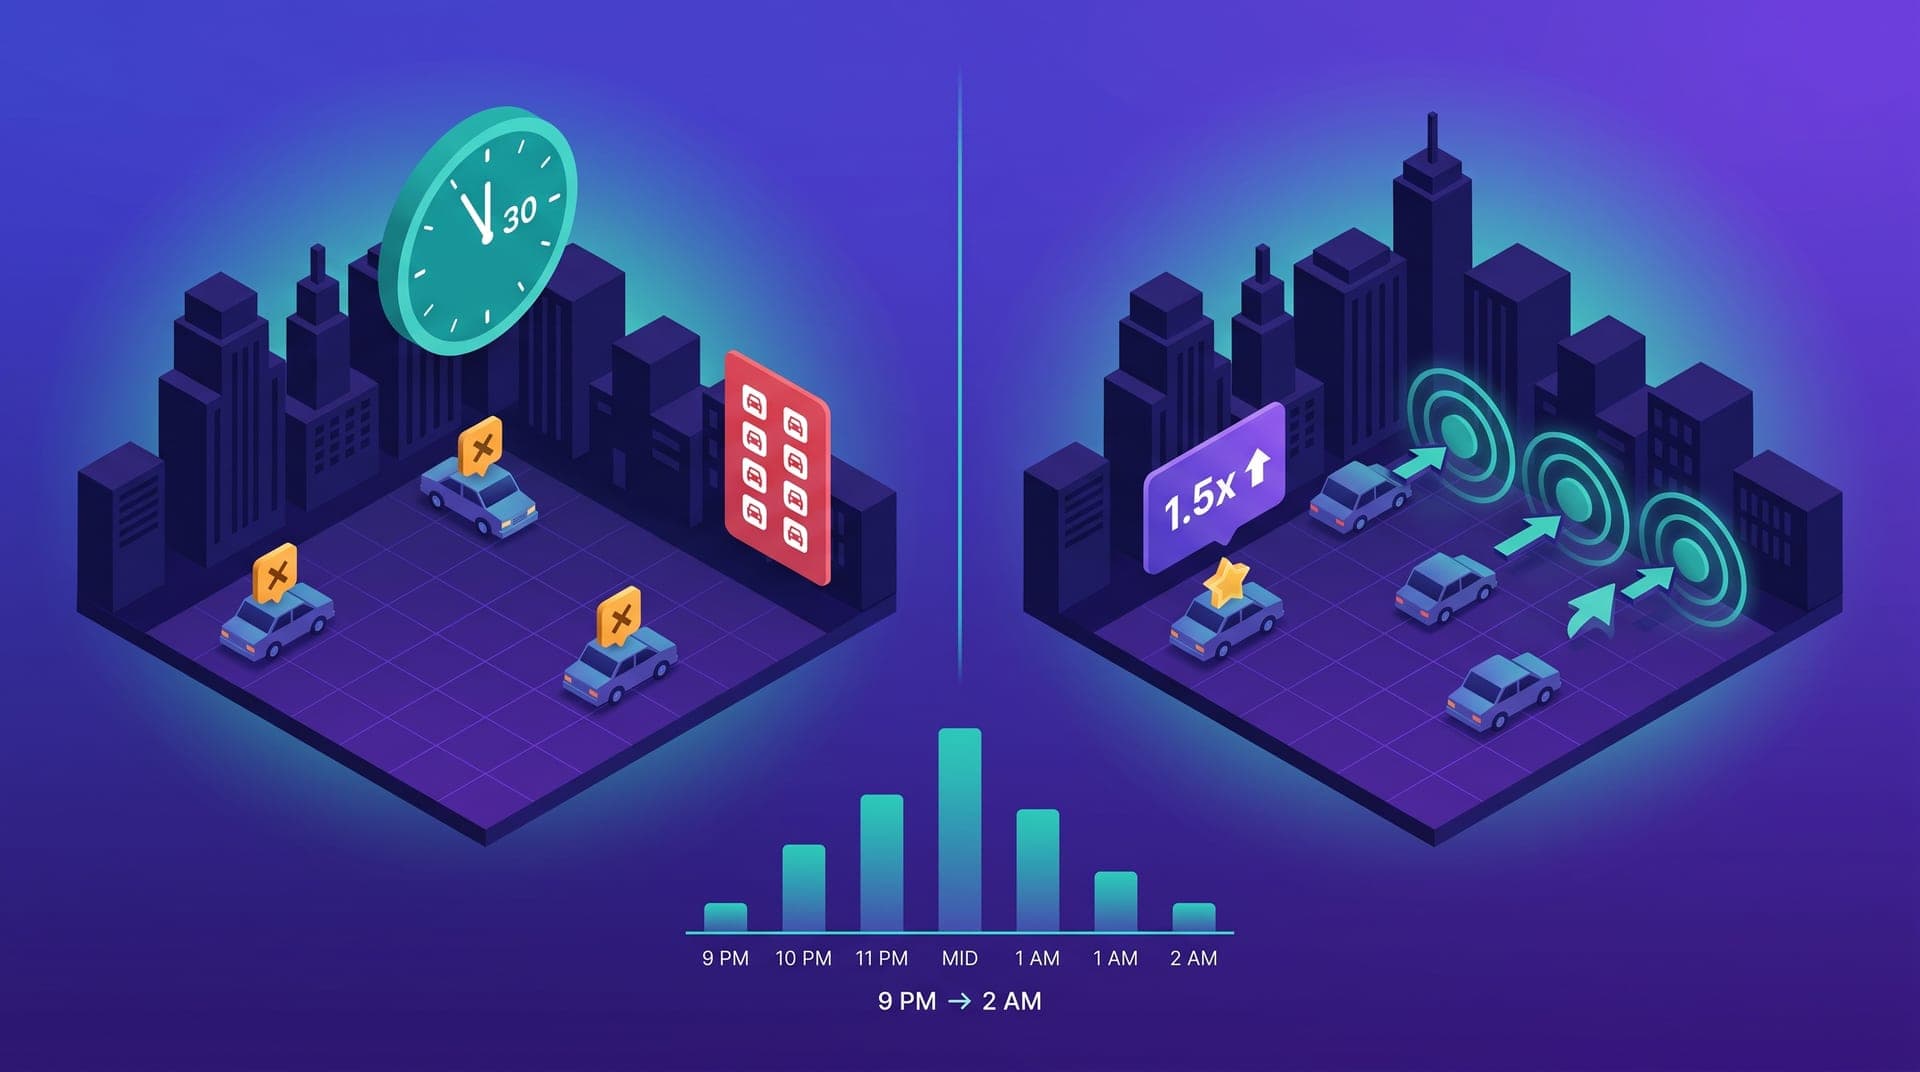
The operation after 10 PM in a regional ride-hailing market doesn't work like the daytime operation. It uses the same app, the same fleet, and the same fare structure — but it has a different demand profile, a structurally higher driver rejection rate, and a risk pattern that daytime metrics don't capture. In cities of 150,000 to 450,000 residents in Mexico and Central America, night demand — from 10 PM to 2 AM — accounts for 18 to 32% of total daily trip volume, but concentrates 40 to 60% of driver rejections above the acceptable threshold, 55 to 70% of passenger cancellations due to excessive wait times, and the densest block of requests with no driver assigned within the operational radius. That asymmetry is structural: the night window generates enough demand to justify operating, but if an operator tries to cover it with the same supply and incentive logic as the daytime operation, the result is systematically worse.
This article is for operators with 20 to 80 active drivers who see a significant share of night requests consistently unserved — rejection rates above 35% between 11 PM and 1:30 AM, or passenger cancellations before assignment in that window — without having calibrated the pricing, incentives, or minimum coverage threshold the night service requires. It covers why night demand behaves differently from daytime demand in terms of trip type, urgency, and passenger patience; what changes in driver supply after 10 PM and why drivers who are productive during the day have structurally different behavior at night; how to calibrate pricing for the night window without losing the conversion that makes the block viable; how to maintain minimum viable night coverage using a targeted incentive structure; what the payment mix reveals about night-specific operational risk; and what the weekly agent review shows in a night-specific diagnostic. The thesis is practical: the night operation is not a worse version of the daytime operation — it is a different operation that happens to run on the same platform. Managing it with day logic produces the rejection and wait patterns that tell passengers the platform doesn't work at night — an impression that, once formed, persists into daytime use.
Why night demand has a different operational profile from daytime demand
Night demand in regional cities has three characteristics that distinguish it from daytime demand and determine what the operational response must be. First, night trips are longer on average. The typical trip between 11 PM and 1:30 AM has an average distance 40 to 65% longer than the average daytime trip in the same market. The explanation is the origin-destination mix: night trips include displacement from restaurant and bar zones toward residential neighborhoods, late-night airport arrivals when budget flights land — concentrated between 11 PM and 1 AM — and emergency medical transfers that cluster between 1 and 3 AM. Second, night demand arrives in short concentrated bursts, not in the sustained flow of the morning or midday peak. In a city of 280,000 residents, a typical Friday or Saturday between 12:30 and 1:00 AM can produce 35 to 50 requests in 30 minutes — a request rate comparable to the morning peak — followed by a sharp drop to 5 to 10 requests between 1:30 and 3:00 AM. Third, night passenger patience is lower in the first 3 minutes and higher from minute 5 to 12. A passenger requesting at 1 AM after a night out is more likely to cancel immediately if there is no assignment in the first 3 minutes, but less likely to cancel between minutes 5 and 12 once a driver is already en route — because the perception of alternatives (walking, waiting for a street taxi) is worse at night than at noon.
The night supply problem: why drivers reject more requests after 10 PM
Driver supply after 10 PM contracts through two mechanisms. The first is structural: drivers with family obligations or early morning schedules — representing the majority of active drivers in markets where the fleet has mixed ages and personal situations — disconnect between 9 PM and 10:30 PM regardless of demand levels that night. In a fleet of 40 active drivers, 25 to 30 will systematically disconnect before 10:30 PM on weekdays. The remaining 10 to 15 represent the effective night supply. The second mechanism is behavioral: among drivers who stay connected at night, the rejection rate rises. The reasons are partly perceived safety — certain zones and passenger profiles generate more uncertainty at night — and partly economic. A driver who earns 95 MXN per active hour during the 7 to 9 AM peak in a concentrated residential zone has a very different cost-benefit calculation for a 1:00 AM trip toward a zone they don't know well, with a passenger who doesn't respond when the driver is 300 meters away.
That night trip generates the same base fare as a daytime trip — because the price doesn't change — but with a qualitatively different level of discomfort and perceived risk. Without a night surcharge, the driver who is comfortable working nights does so voluntarily, and the driver who isn't won't work nights at any request volume. The operational consequence is a night fleet of 10 to 15 drivers covering demand of 30 to 50 requests at the midnight peak, with a rejection rate that climbs to 35 to 55% when the proportion of drivers comfortable with night trips is insufficient for the concentration of requests in that window. The solution is not to force daytime drivers to work nights or to hire specifically night drivers: it is to calibrate the price and incentive so that the night window is economically attractive for the subset of drivers who are already willing to work it.
Night pricing: when to activate the surcharge and at what level without killing conversion
Night pricing in regional markets has different elasticity than daytime pricing. Between 10 PM and 11:30 PM — the early night window — passengers retain enough alternatives that a price above 1.3x base reduces request volume meaningfully. Between 11:30 PM and 1:30 AM — the deep night window — the alternatives calculus changes: fewer passengers have their own vehicle available, walking is less safe, and the urgency of the trip is higher. In that window, prices of 1.4x to 1.9x base in regional markets produce a request volume reduction of 10 to 22% — smaller than what a 1.5x rate would produce in the same market's morning peak. After 1:30 AM, volume drops naturally and any rate above 1.2x produces disproportionate cancellations relative to the already-low demand. The practical implication: there is a night pricing window where a surcharge of 1.4x to 1.7x base achieves two objectives simultaneously — it raises the driver's per-trip income enough to compensate for the higher discomfort cost of night work, and it maintains enough conversion to sustain viable request volume for the 10 to 15 night drivers.
The common error in night pricing is applying a uniform surcharge from 10 PM to 3 AM and discovering that conversion drops in the 10 to 11:30 PM window — where the elasticity doesn't support it — while drivers still reject after 1:30 AM because volume is too low. The more effective structure is three distinct night segments: base rate until 11 PM to avoid early-night price resistance; 1.4x to 1.6x from 11 PM to 1:30 AM to compensate drivers in the high-volume deep night; and return to base after 1:30 AM because volume no longer justifies a premium that further discourages the few remaining passengers. The agent query that produces the three-segment calibration for a specific market: 'For the last eight Friday and Saturday nights, show me request volume and completion rate by 30-minute interval from 9 PM to 3 AM. For each interval, include median wait time and driver rejection rate. Identify the two or three intervals with the highest ratio of unserved requests and the highest rejection rates — those are the intervals that need pricing adjustment.'
Minimum viable night coverage: how many drivers you need and how to have them
The night coverage target is not the same as the daytime coverage target. In a daytime operation with 40 active drivers and a morning peak of 150 to 200 requests per hour, keeping 30 to 35 drivers in the right zones during the peak is the coverage objective. In the same market's 11:30 PM to 1:30 AM window, the request rate is 35 to 65 per hour, and trips are longer — requiring the driver to be out of circulation 15 to 25 minutes per trip versus 10 to 15 minutes during the day. That means 8 to 12 actively connected drivers in the right zones can serve night demand at an 85 to 92% completion rate, while 5 to 7 drivers in dispersed positions produce 55 to 68% completion in the same demand window. Minimum viable night coverage requires fewer total drivers than daytime coverage, but much more geographic concentration: in most regional cities, 80% of night demand originates from 2 to 4 specific zones — the bar and restaurant corridor, the hospital, the bus terminal, and the main hotel area.
The four mechanisms that sustain minimum night coverage without requiring additional drivers or destroying the operation's margin:
- **Connectivity bonus**: 80 to 120 MXN additional for staying connected and positioned in the designated zone between 11:30 PM and 1:30 AM, regardless of the number of trips made. That bonus covers the driver's opportunity cost without requiring them to accept trips they consider risky or to modify their fares.
- **Night-specific positioning instruction**: 30 minutes before the start of the night window, the driver active in that slot receives the positioning instruction for that night: specific zone, expected request volume based on the day of the week, and historical income reference for that zone-slot combination. That information reduces rejection driven by uncertainty about whether demand will be sufficient to justify staying connected.
- **Deferred assignment priority**: drivers who regularly work the night shift receive preferential assignment for longer-distance — and therefore higher-income — requests during the following 48 hours. The incentive is deferred but concrete and accumulates over weeks, creating a preference for the night shift among drivers who maximize total weekly income.
- **Night minimum income guarantee**: if the driver active in the night window doesn't reach 80 MXN per active hour during the guaranteed slot and stayed in the designated zone, the operator covers the difference up to that threshold. The guarantee eliminates the economic risk of the night for drivers who don't yet know the city's night demand pattern, and costs the operator less than 150 MXN per driver on nights when demand was below the threshold.
What the payment mix reveals about night operational risk
The cash payment proportion shifts significantly in the night window. In operations where cash represents 40 to 55% of total daytime transactions, the proportion in the 11 PM to 2 AM window rises to 60 to 75%. That shift has two operational implications. First, a larger share of night revenue passes through the driver's hands before reaching the platform's liquidity pool — affecting the operator's working capital if the settlement cycle is daily. Second, cash-heavy night operations concentrate a subset of drivers who actively prefer cash transactions: a pattern that correlates with drivers who selectively accept cash trips and reject digital payment trips, artificially inflating the rejection rate for digital payment passengers. The agent query that surfaces this pattern: 'For the last four weeks, show me the rejection rate by payment method — cash vs. digital — in the 10 PM to 2 AM window, broken down by driver. Flag drivers whose rejection rate for digital payment trips is more than 20 percentage points higher than their rejection rate for cash trips in that window.' Drivers with that pattern are selectively filtering digital passengers at night, reducing the availability the platform shows to those passengers and creating a systematic service quality gap in the night window.
The weekly night review: what to ask the agent and what to do with the result
The weekly night review query that produces the operational picture of the previous week: 'For the last seven nights, show me for each night: total requests between 10 PM and 2 AM, completion rate, median wait time before driver assignment, median driver rejection rate, the two zones with the highest number of unassigned requests, the number of drivers connected each hour between 10 PM and 2 AM, and the median income per active hour for night drivers. Separate the Friday and Saturday data from Monday through Thursday.' The result maps the night operation without additional inference: it shows which nights had supply gaps, which zones concentrated unserved demand, and whether the rejection rate in the night window was above the 25 to 30% threshold that signals a structural supply problem rather than a specific event. The operator who runs this query every Monday morning has the complete prior-week night diagnostic in one table — including whether night pricing is producing the conversion rate the operation needs to sustain a viable driver incentive structure.
When I started reviewing night operations as a separate block, I found that on Fridays I had 47 unserved requests between 12:30 and 1:15 AM — the same unserved volume as a full Monday. I had 12 drivers connected but 9 were in the industrial zone, where there are zero requests at night. I started sending the positioning message at 11:45 PM pointing to the restaurant corridor, activated 1.5x starting at midnight, and offered a 100 MXN bonus for staying connected until 1:30 AM. Night completion rate went from 57% to 84% in four weeks without hiring a single additional driver.
Night operations in regional ride-hailing is not a scaled-down version of the daytime operation. It has shorter supply, more time- and geography-concentrated demand, different passenger urgency, and a driver risk calculus that requires a specific economic compensation to sustain coverage. The operator who tries to manage the night window with the same positioning logic, the same pricing, and the same supply assumptions as the 8 AM peak will systematically produce the rejection rates and wait times that tell the market the platform doesn't work at night — an impression that, once formed, is harder to reverse than it was to prevent. The passenger who cancelled twice at 12:30 AM because no driver was available doesn't try again the following Friday: they start building an alternative behavior, and that affects daytime use as well.
The data to manage the night operation is already in the platform: request volume by zone and interval, driver positions, rejection rates by time slot, payment method mix. The three operational changes that close the structural gap between night demand and night supply don't require a different product: a pricing surcharge in the deep night window that compensates drivers for the additional discomfort cost of night work; a targeted incentive for the 8 to 12 drivers who cover the window consistently; and a weekly diagnostic query that shows which zones had the most unserved demand the prior week. That cycle — diagnose, position, adjust pricing, measure — is the same one that works in the daytime operation. The only difference is that for the night window it requires setting the parameters once and verifying weekly that coverage holds.