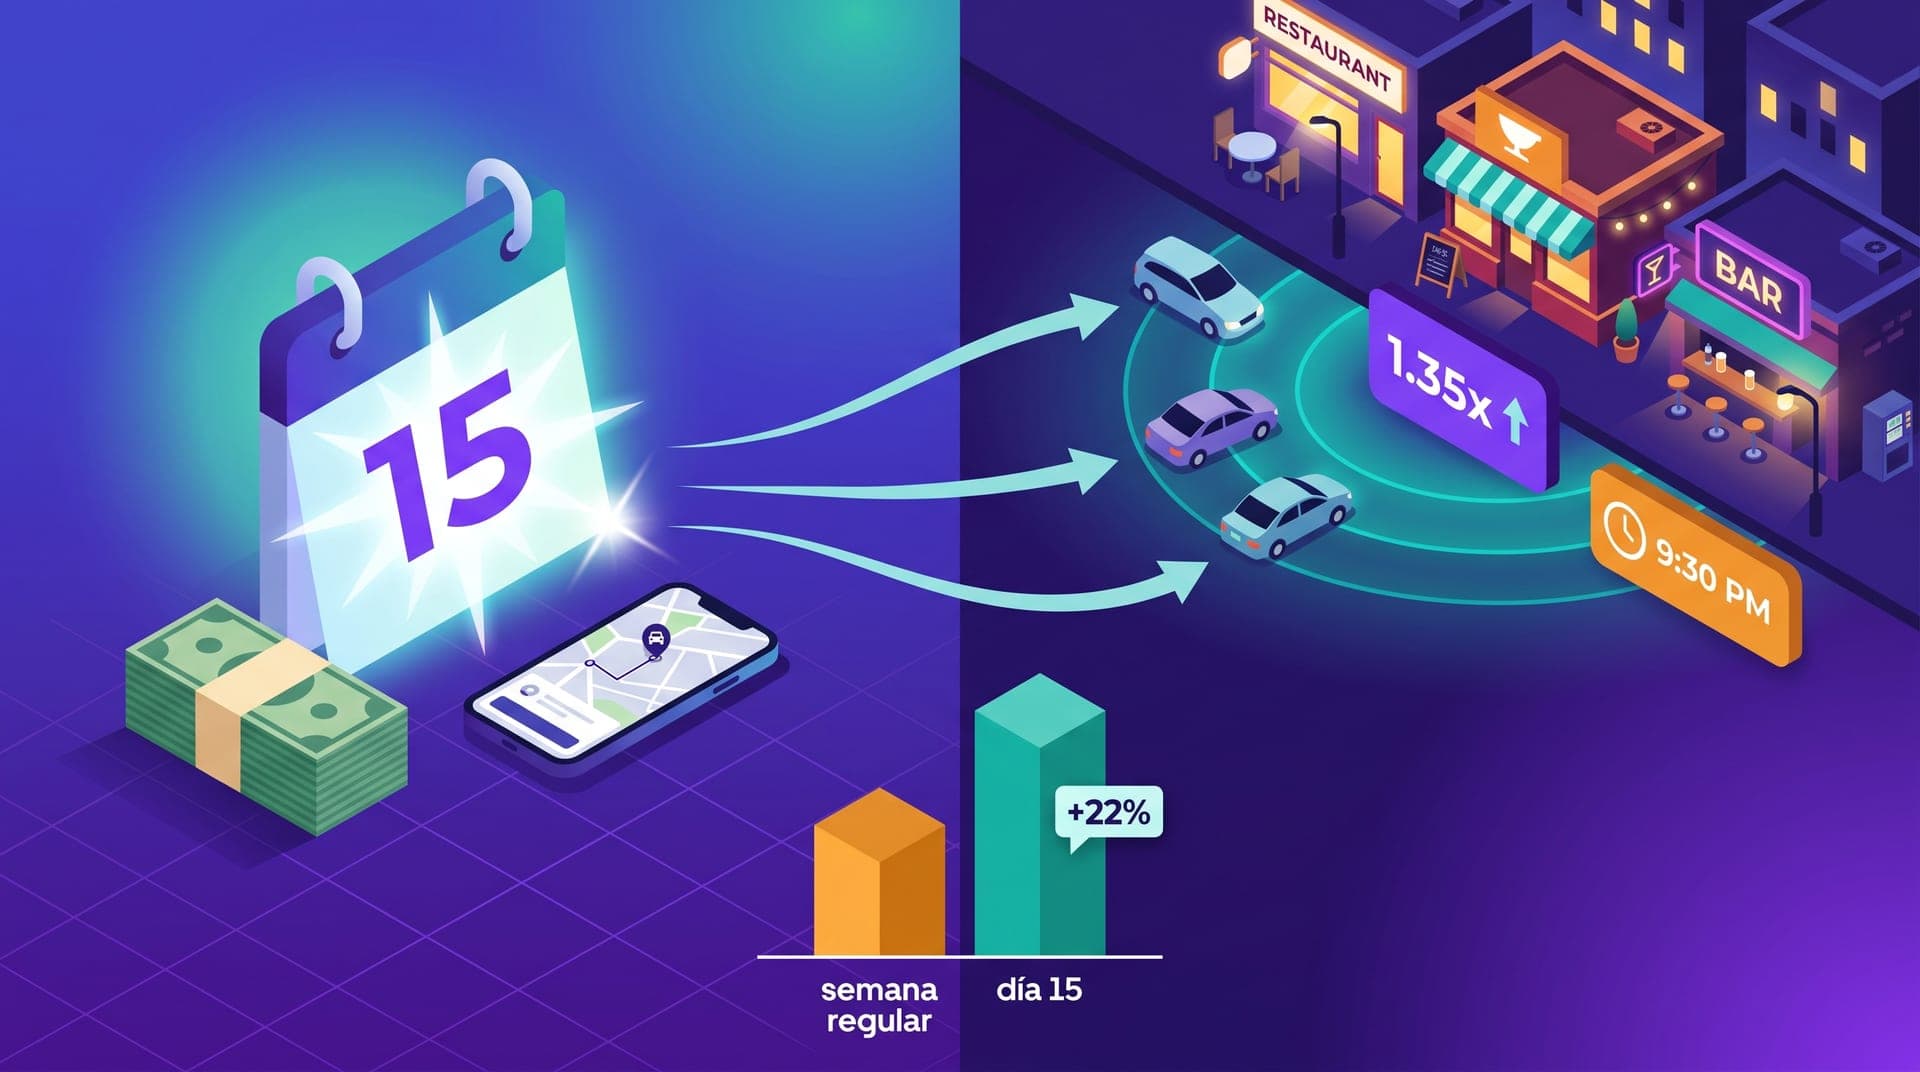
In a regional ride-hailing operation in Mexico or Central America, the 15th and last business day of each month are not administrative dates — they are demand events. In markets where the quincena — the fortnightly salary payment cycle — is the dominant income structure for formal and informal workers, the moment wages arrive in hand produces a predictable shift in discretionary spending over the following 24 to 48 hours. In ride-hailing, that shift translates into a demand uplift of 12 to 28% compared to the same weekday and time slot in the mid-month period, concentrated primarily in evening trips toward leisure zones and a passenger with noticeably lower price sensitivity than the rest of the month. The difference from other demand peaks — rain, the weekend, a mass event — is that the quincena requires no forecasting: the 15th is always the 15th, and month-end always arrives.
This article is for operators with 15 to 60 active drivers in cities where the bi-monthly payroll cycle is the norm — primarily Mexico and Central America — without a differentiated process for those dates in their operational calendar. It covers why the payroll cycle generates marginal demand in ride-hailing and what economic mechanism explains it; how the trip profile changes on quincena days — request timing, destination, average distance, price elasticity; in what exact time window the uplift occurs and how it decays after the peak; how to structure an anticipatory pricing adjustment that drivers see before deciding whether to work that evening block; how the quincena affects fleet availability; and what agent query produces the historical quincena demand map in your city to confirm whether the pattern exists and how many additional trips per month it represents. The thesis is concrete: the quincena is the easiest demand event to anticipate in a regional LATAM operation, and most operators treat it like any other Wednesday.
Why the payroll cycle generates marginal demand in ride-hailing
The mechanism is one of marginal consumption: when a formal or informal worker receives their quincena, disposable income available for discretionary spending increases for 24 to 72 hours before fixed payments — rent, utilities, debts — absorb most of the balance. In that window, the passenger who would normally walk 4 blocks, wait for public transit, or decide not to go out at night chooses to do what they wouldn't do on an average day: go to a restaurant, meet friends, or simply move with greater comfort. In regional operations in cities of 150,000 to 500,000 residents in Mexico and Central America, the marginal passenger activated by the quincena — the one who does use the platform that day but wouldn't on a regular mid-month Wednesday — can represent 8 to 20% of total requests in the evening blocks on the 15th and last business day of the month. That passenger is not a new user: they are a registered user who in the mid-month period lacks the disposable income for the discretionary decision to take a cab.
A second factor amplifies the effect: the quincena temporarily lowers passenger price sensitivity. The operator who activates a 1.2x to 1.4x surcharge in evening blocks on the 15th and month-end in leisure zones does not see the conversion drop that the same surcharge produces on a regular mid-month Tuesday. In the mid-month period, the passenger evaluating the trip cost against public transit makes the calculation with a tighter budget and chooses the cheaper option more often. On quincena days, that same passenger makes the calculation with a momentarily larger budget and accepts the surcharge if the platform delivers immediate availability. Price elasticity on quincena days is 15 to 25 percentage points lower than in the same time slot during the mid-month period, meaning the surcharge produces fewer cancellations and driver income per trip rises without the proportional conversion loss that surcharge would produce on a regular date.
The quincena trip profile: nocturnal, longer, different destination
The quincena trip has a measurable profile that departs from the ordinary trip in three dimensions. The first is request timing: on quincena days, the demand uplift concentrates in the 7 PM to 1 AM blocks, with the peak between 9 PM and 11 PM. During daytime and morning hours, request volume on quincena days is practically identical to that of a comparable mid-month period day — the received income has not yet converted to discretionary spending, because most workers receive payment at the end of the workday or in the early afternoon. The second dimension is distance: the quincena evening trip is on average 20 to 35% longer than the mid-month period evening trip. The explanation is the destination: the quincena passenger is going to restaurants or leisure zones that in many regional markets are farther from residential areas than the typical weekday destination — work, a store, an errand.
The third dimension is passenger cancellation rate: on quincena days, the pre-assignment cancellation rate is 10 to 18 percentage points lower than in the same time block on a regular mid-month period day. The passenger who opens the app on a mid-month Tuesday at 10 PM to go to dinner with friends cancels if there's no assignment in 3 to 4 minutes — that trip is optional and the patience threshold is low. That same passenger on the 15th at 10 PM has a firmer intention: they made the decision to go out and celebrate the quincena, and the probability of waiting 5 to 7 minutes is higher because the cost of not getting the trip — staying home, seeking a slower alternative — carries more weight than on a regular weeknight. That lower cancellation rate has a direct effect on driver productivity: more completed assignments per hour, with less time spent on trips that cancel before arrival.
The quincena uplift time window: when demand rises and when it returns to baseline
The quincena demand uplift doesn't occur exactly on the 15th: it has a temporal distribution that operators need to know to position incentives correctly. The prior night — the 14th or the second-to-last business day of the month — already shows a mild 5 to 10% increase in evening blocks, because some workers received payment a day early or because the anticipation of the payment activates the decision to go out. The night of the 15th or last business day of the month is the main peak: a 12 to 28% increase in request volume from 7 PM to 1 AM, depending on market size and the concentration of formal workers with a fixed quincena date. The following night — the 16th or first of the month — shows a residual uplift of 6 to 12% that decays toward the average as fixed payments absorb the available balance. From that point, demand returns to the mid-month baseline until the next quincena.
The five quincena cycle patterns the operator needs in their monthly calendar:
- **Night of the 14th or second-to-last business day**: mild 5-10% uplift in the 9 PM to 1 AM blocks. Activate preventive pricing in leisure zones from 9 PM to retain connected drivers before the main peak.
- **Night of the 15th or last business day**: main demand peak, 12-28% above the mid-month level in the 7 PM to 1 AM blocks. Highest concentration in restaurant, bar, and plaza zones. Moment of lowest passenger price elasticity.
- **Night of the 16th or first of the month**: residual 6-12% uplift, decaying toward baseline. Maintain moderate pricing until 11 PM; deactivate after to avoid taxing a block that has returned to ordinary levels.
- **Mid-month days (2nd through 13th, 17th through 28th)**: base demand level and standard pricing. The contrast with quincena blocks is more visible in markets with a relatively flat weekday demand pattern.
- **December, month-end**: the aguinaldo (year-end bonus) amplifies the December month-end uplift. On evenings from the 20th through 31st, the quincena effect overlaps with the aguinaldo and Christmas effect, producing the highest evening demand peaks of the year — 35 to 60% above the mid-month baseline of November.
How to anticipate the quincena peak with calendar pricing, not reactive adjustment
The operational difference between quincena pricing and rain pricing is that the former can be scheduled on the calendar 30 days in advance — without any external forecast — while the latter requires a daily weather review. In operations with pricing configuration by time slot, the quincena adjustment has three components: the date range — evenings of the 14th, 15th, and 16th and their month-end equivalents; the time range — 7 PM to 1 AM, not during the day; and the geographic zone — exclusively leisure zones, restaurants, and the main square, not residential or mass-access commercial zones. Applying the surcharge in residential zones on quincena day is an error: the passenger going from home to work or the bank that morning does not have the reduced elasticity of the evening leisure passenger, and the unnecessary surcharge in that block generates cancellations that reduce conversion without producing the additional income that would justify the adjustment.
The mechanism by which anticipatory pricing works better than reactive pricing for quincena is the same as for rain: the driver who sees the surcharge activated from 7 PM on the evening of the 14th — before the peak begins — makes the connection decision for that block with economic information available. The driver who receives the surcharge as a reaction to the first unserved requests at 9:30 PM may already be 8 km from the highest-demand zone or have taken a long trip that moved them away from the leisure corridor. In operations where the quincena evening surcharge activates at 7 PM rather than 9 PM, driver coverage in leisure zones at 9 PM is 20 to 35% higher than when the surcharge activates reactively. Anticipatory quincena pricing doesn't require the operator to be active in that moment: it's configured once per month — or repeated with a fixed date through a system rule — and the adjustment happens without manual intervention.
Driver availability on quincena: the late block that needs its own incentive
The quincena's effect on driver availability is more complex than on demand, and varies by fleet profile. Full-time drivers — those who depend on the platform as their primary income source — tend to work the quincena evening block actively if the surcharge is visible before 7 PM, because they know the expected income for that night is 20 to 30% higher than a regular weekday evening block. Part-time drivers — those with another primary income source — show variable behavior: some work more on quincena days because they anticipate higher request density; others work less because they already have their day's income and the motivation to go out and work at night is lower. The net result in most regional operations is a modest increase in available drivers in the 7 PM to 10 PM window on quincena days — on the order of 5 to 15% — followed by a drop in the 10 PM to 1 AM window that in some markets leaves supply below demand level in the later peak.
The agent query that confirms whether the quincena pattern exists in your operation
Before configuring differentiated quincena pricing, the operator should verify that the pattern exists in their market — the magnitude of the effect varies by local labor market composition. The agent query that produces that verification: 'For the last 90 days, identify all days that are the 14th, 15th, 16th, second-to-last business day, last business day, or first of the month. Compare them against days of the same weekday that don't fall in any of those categories — for example, quincena Tuesdays vs regular non-quincena Tuesdays in the same period. For each comparison group, show average request volume in the 7 PM to 1 AM block, completion rate, average trip duration, and the three zones with the highest request concentration in that block. Indicate what percentage of quincena days have request volume in that block more than 10% above the comparison group average.' If 2 or 3 of the 3 cycles analyzed show consistent uplift, the pattern exists and the pricing adjustment has measurable return.
The complementary query that calibrates whether the quincena pricing was well-adjusted in the prior cycle: 'For the last 3 quincena cycles, compare driver income per active driver in the 7 PM to 1 AM block on quincena days against income in the same block on nearest mid-month comparison days of the same weekday. Also show the difference in driver rejection rate between quincena days and comparison days, and whether the quincena completion rate was higher, lower, or equal in the last 3 cycles.' That result allows deciding whether the surcharge was correctly calibrated — higher per-driver income without conversion drop — excessive — higher passenger cancellation rate than in the mid-month period — or insufficient — no income difference versus the mid-month period in that block. Both queries together take 10 minutes of review and produce the diagnostic to adjust the next month's quincena calendar before it starts.
After 11 months of operation I had never connected the midnight Tuesday spikes to quincena day. My coordinator mentioned that drivers always asked for an extra shift on the 15th because 'there's more movement.' I asked the agent to compare my quincena Tuesdays against regular Tuesdays in the prior three months. In all three 15th-day Tuesdays, request volume from 8 PM to 1 AM was 19 to 24% higher than on other Tuesdays, and my completion rate was 7 points lower because I had no drivers in the restaurant corridor. I activated a 1.35x surcharge from 7 PM on the 14th and 15th and sent the positioning message to 8 drivers that afternoon. The next quincena cycle my completion rate in that block went from 71% to 88%.
The quincena doesn't need a complex protocol: it needs a place in the operator's monthly calendar. Unlike rain — which requires checking the forecast each afternoon during the season — or the weekend — which has its own fixed coverage logic — the quincena has a date known 30 days in advance and its two operational parameters are predictable: evening pricing in leisure zones and an incentive for the late block covering the drivers who would otherwise disconnect before the peak reaches its maximum. The operator who configures those two adjustments once at the start of each month — four dates, two pricing configurations, two positioning messages for each cycle — converts the quincena event from an ignored peak into the highest income-per-active-hour block of that week for the drivers who work it.
The two metrics that determine whether the quincena cycle is being captured are simple: the volume of completed requests in the quincena block compared to the same block in the prior non-quincena week, and driver income per active hour in that block compared to the monthly average. If the quincena block produces 12 to 28% more completed requests and driver income in that block is 15 to 25% higher than in the mid-month period, the cycle is being captured. If both figures match the mid-month period, the operator is ignoring the most predictable demand event of their month. The agent that has those data points available for the Monday review turns the quincena diagnostic into part of the regular weekly review process — not an additional analysis — and the operator who runs it each month has an anticipated revenue window that their competitors likely don't have on their calendar.