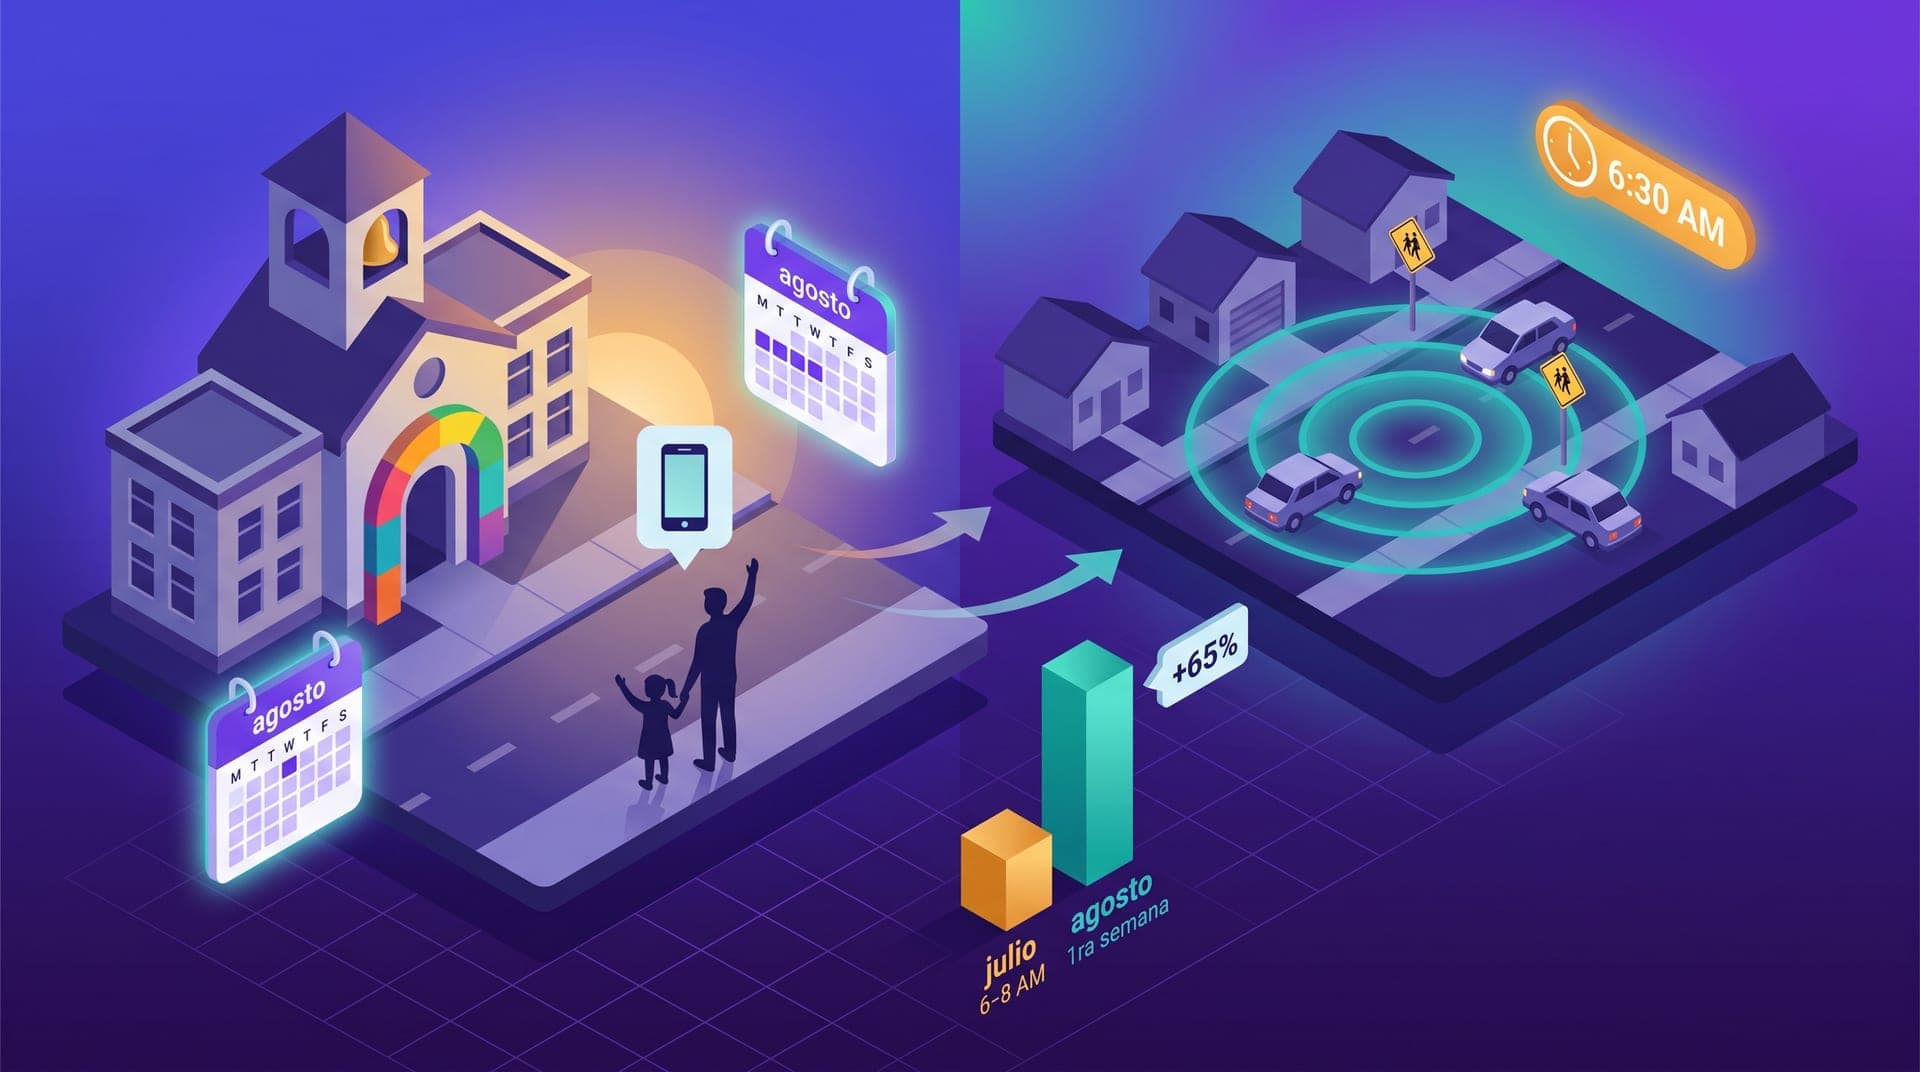
In ride-hailing operations across Mexico and Central America, the first day of the August school year is one of the most predictable demand events of the year and one of the least managed. In cities of 100,000 to 500,000 residents where the school calendar starts in the third or fourth week of August, the 6:30 to 8:30 AM block during the first week of school generates a 40 to 80% increase in morning ride requests compared to the same block during the final weeks of summer vacation. That spike doesn't come from new users: it comes from registered passengers who had no reason to request a trip at 6:45 AM during vacation but who in the first week of school need to get children to class on time, get themselves to work, or handle both simultaneously. The structure of this event is different from every other demand event the operator already knows: it isn't nocturnal like the quincena, it isn't weather-driven like rain or heat, and it doesn't repeat monthly — it happens exactly once a year, for five business days, in a specific morning time block. The operator who has a rain protocol, a quincena protocol, and a weekend protocol but no back-to-school protocol is capturing recurring demand events while missing the highest morning spike of the year.
This article is for operators with 15 to 60 active drivers in cities where the school calendar affects mobility demand — primarily Mexico and Central American markets where back to school happens in August — without a differentiated process for that week in their operational calendar. It covers why back to school generates marginal ride-hailing demand and how it differs from ordinary weekday trips; the school trip profile — distance, time window, passenger behavior; how long the spike lasts and how it decays in the second week; why the school demand zone map doesn't match the quincena or rain map; how to structure the block bonus that activates drivers in the earliest morning block of the year; and the agent query that verifies whether the pattern exists in historical operation before investing time in configuring the protocol. The thesis is direct: back to school is the third most predictable demand event of the year after the quincena and weekends, and the operator without it on their calendar is managing the most concentrated week of the year reactively.
Why back to school generates marginal ride-hailing demand
The mechanism of the back-to-school spike differs from the quincena — which activates discretionary spending — and from heat or rain — which increase the perceived cost of alternative transport modes. Back to school activates punctuality-driven trips: the parent dropping off a child has a 10-to-15-minute delivery window before the school gate closes, and a delay has real consequences — a tardy note for the student, or tardiness at their own job if the parent goes directly from school to work. During vacation, that same parent could leave home at any time; in the first week of school they face a strict schedule constraint that raises the perceived value of punctuality above the cost of the fare. In cities where traffic concentrates heavily around school zones during the 7:00 to 8:00 AM block — as vehicles from dozens of families converge on the same compact area — the car-owning parent has an additional incentive to use the platform: they arrive faster by taxi than in their own vehicle, which would be stuck in the congestion in front of the school.
The user profile that generates incremental demand at back to school is the parent or guardian with school-age children who didn't use the platform for morning trips during vacation. In regional operations in cities of 100,000 to 500,000 residents in Mexico and Central America — where the age pyramid is younger than in large metropolitan areas — that segment can represent 15 to 35% of registered users. A second group that amplifies the effect is adults without school-age children who in the first week of school face longer commute times from school-zone traffic, and who turn to ride-hailing to avoid arrival uncertainty. That second group extends the demand spike beyond immediate school zones into adjacent traffic corridors. The combination of both groups produces the most concentrated uplift of any morning of the year in that specific time block.
The school run trip profile: short, time-sensitive, and packed into 60 minutes
The school run trip has three measurable characteristics that distinguish it from an ordinary weekday trip. The first is distance: school trips in regional LATAM cities average 2 to 5 kilometers — significantly shorter than the platform's typical trip distance during the rest of the day, which usually falls between 6 and 10 km. The reason is geographic: in cities of that size, most schools are within the same neighborhood or in adjacent zones to where students live. That means each school trip carries a lower average fare than an ordinary trip, but the trips-per-active-hour rate is higher: the driver completes more runs per hour in the school block than in any other morning block of the year, because each trip is short and requests are concentrated in a few square kilometers around the city's largest schools.
The second characteristic is the request window: 75 to 85% of morning school trips are generated in a 45-to-60-minute period — from 6:45 to 7:45 AM in cities where the morning school shift starts at 8:00 AM. That level of temporal concentration exceeds any other regular demand event the operator knows: the quincena distributes its peak across 4 to 5 evening hours; rain lasts 45 to 90 minutes but can occur at any hour. The school morning block has the highest request-per-minute density of any event in the operational year. The third characteristic is passenger wait tolerance: the parent with a hard schedule deadline cancels faster than the ordinary passenger if wait time exceeds 4 to 5 minutes. In the school block, driver coverage in the right zones — within 2 km of the largest schools — determines the completion rate more directly than in any other event: immediate availability under 4 minutes of wait is the critical factor.
The school demand map: zones that don't align with any other operational protocol
The demand map during the first week of school differs from every other map the operator uses throughout the year. The quincena concentrates demand in nocturnal restaurant and leisure corridors; rain and heat activate requests from markets, public transit stops, and commercial zones; weekends generate dispersed demand citywide. Back to school concentrates demand in residential zones within a 1-to-3-kilometer radius of the city's largest schools — elementary schools with over 300 students, middle schools, high schools, and universities with morning shifts starting at 7:00 or 8:00 AM. Those residential zones have different operational characteristics from commercial ones: narrower streets, denser traffic during the school block, and specific drop-off points that don't correspond to any high-demand zone in other protocols. The operator who activates the rain or quincena map for back to school positions drivers where there are no school requests.
The school zone map has an operational advantage the other demand maps don't have: it's stable from year to year. Schools don't change location frequently, and the neighborhoods where students live don't either. The operator who identifies in their historical operation the 3 to 5 zones with the highest concentration of requests in the 6:30 to 8:30 AM block during the previous year's back-to-school week has the map for the following August without any need to recalibrate it. Comparing the school map against the rain or quincena map for the same period confirms in most operations that they are different: the markets and leisure corridors that concentrate demand in those other events are not the same school and residential zones of the school-day morning. That difference requires specific positioning instructions for back-to-school drivers — not the same communication from the rain protocol applied to a different date.
How long the spike lasts: the first week captures 70% of the annual effect
The back-to-school demand spike has a specific duration that operators need to know to avoid running the protocol longer than necessary. The first week of school generates 65 to 80% of the total school demand effect for the August-through-December period in the morning block. In the second week, demand in school zones in that block drops 30 to 45% from the first-week peak, though it remains above the vacation baseline because school runs are now part of the daily schedule for a subset of families. By the third week, the pattern stabilizes: families who found ride-hailing convenient for the school run continue using it regularly; those who worked out their logistics another way — carpool, school van, their own car — don't return to the morning pattern. For the operator, the back-to-school protocol is a 5-day investment, not a full-August commitment.
The five back-to-school cycle patterns the operator needs in their calendar to correctly activate and deactivate the protocol:
- **First week (school days 1-5)**: main peak, 40-80% above the same block during the last weeks of July. Activate school-zone positioning, a block bonus, and send the positioning message to drivers the evening before the first day.
- **Second week (school days 6-10)**: residual uplift of 20-35%. Keep the positioning message but without an additional bonus — request density is already sufficient for full-time drivers to prioritize the block by volume alone.
- **First-week afternoon block (1:00-2:30 PM)**: in cities where elementary schools run until 1 PM, the afternoon pickup block generates a 25-40% uplift from school run returns. Occurs in zones different from the morning drop-off area.
- **Universities with morning shifts**: the Mexican university calendar often starts on different dates from primary and secondary schools. University demand peaks later — 8:00 to 10:00 AM — in zones distinct from elementary and middle schools.
- **From the third week onward**: stabilized baseline. Continuing to send school-zone positioning messages after the second week produces no additional return and creates noise in driver communications.
Block bonus and pricing for back to school: why 1.1x outperforms 1.3x
Pricing adjustment in the first week of school requires a different approach than the quincena evening block. The quincena passenger is an adult with freshly received income going out to spend with lower price sensitivity. The back-to-school passenger is a parent with a genuine punctuality need and a household budget that has already absorbed start-of-term expenses: uniforms, school supplies, registration fees, new shoes. Price sensitivity in the school morning block is higher than in the quincena evening: the parent needs the service, but doesn't have the same disposable income as on the 15th. In operations where a surcharge of 1.25x to 1.35x was applied during the school block in the first week, pre-assignment cancellation rates rose 18 to 24 percentage points — signaling that parents perceive the surcharge as unjustified for a short necessity-driven trip on the highest-spending day of the year. A surcharge of 1.05x to 1.15x keeps conversion practically identical to an ordinary day and activates driver availability in the early block without generating the perception of exploiting family need.
The most effective mechanism for activating drivers in the 6:30 to 8:30 AM block of the first week of school is not the pricing surcharge but the block bonus: an incentive of 60 to 90 MXN for completing at least 3 trips in that block during the first 3 school days. The driver who receives that message the evening before the first day makes the decision to get up early with economic information available: they know the 6:30 AM block in school zones will have above-normal request density and that there is a specific bonus for completing trips in that time slot. That driver arrives positioned before the peak begins, rather than reacting to the first unassigned requests when the operator activates the incentive reactively at 7:30 AM. The combination of an advance block bonus and a specific school zone map converts the first five August school days into the highest income-per-active-hour block of any morning of the year for the driver who works it.
After two school years I still hadn't understood why my drivers kept telling me there was 'a lot of movement in the mornings' during the first week of August. When I asked the agent to compare my 6:30 to 8:30 AM block for the first week of August against the same block in the last week of July the previous year, I found request volume was 58% higher. But my completion rate in that block was 55% because no driver was near the school zones at that hour. The next year I sent the map of the five largest schools to my full-time drivers the evening before the first day and offered a 70 MXN bonus for 3 trips in that block. My completion rate went to 81%, and my drivers told me it was the most productive Tuesday of the year.
The agent query that confirms whether the school pattern exists in your operation
Verifying the pattern in historical operation is the first step before designing the protocol. The agent query that produces that verification: 'For the last two years, compare the average request volume in the 6:30 to 8:30 AM block during the first 10 business days of the school year start — approximately August 18 through 29 in Mexico — against volume in the same block during the last two weeks of July. For each group, show daily request volume, average trip distance, completion rate, and the four zones with the highest request concentration in that block. Note whether the pattern is consistent across both school years analyzed or appeared in only one of the two years.' If the first school week shows request volume in that block more than 25% above the same block during the last vacation weeks in at least two of the two years analyzed, the pattern exists in your operation and the protocol has measurable return. If the increase is below 15%, the school spike is small enough for the natural driver rotation to absorb it without specific additional instructions.
The complementary query that calibrates whether the problem is supply or demand: 'For the most recent school year's first week, show me the average wait time in the 6:30 to 8:30 AM block in the highest-concentration zones for that block, and the percentage of requests that went unassigned. Compare that wait time against the same block in the two weeks before the school year started that same year. If the first-school-week wait time exceeds the vacation-period block by more than 50%, the problem is supply — drivers weren't in the right zones — and the positioning protocol with a block bonus has its greatest return on that first day. If wait times were similar and request volume didn't rise significantly, the spike didn't exist or was too small in your market.' The two queries together determine whether the back-to-school protocol is relevant in your city and which lever is primary: a block bonus to activate additional supply or a positioning map to redirect existing supply.
Back to school doesn't require an elaborate protocol: it requires a decision made a week in advance. Unlike rain — which requires checking the forecast each afternoon during the season — or the quincena — which requires monthly pricing configuration — back to school has a date known months in advance and two simple operational parameters: the school zone map of the city, stable from year to year, and the positioning message with a block bonus to drivers the evening before the first day. The operator who configures those two elements once a year — the map in July, the message in August — converts the most concentrated morning spike of the year into the highest income-per-active-hour block of any morning on their calendar for the drivers who work it.
The metrics that confirm whether the protocol worked are the same as for any demand event: the completion rate in the 6:30 to 8:30 AM block during the first week of school compared to the same block in the last weeks of July, and the average wait time in school zones during that block. A well-executed protocol produces a completion rate equal to or above the platform average — not below — and wait times under 5 minutes in the identified high-density zones. The agent query run at the end of the first school week converts the event into a calibration diagnostic that improves the protocol for next August, rather than a period that simply passes without data. Back to school is the demand event with the most predictable date of the year: the operator who doesn't have it on their calendar is missing the most concentrated morning demand block of the 365 days.