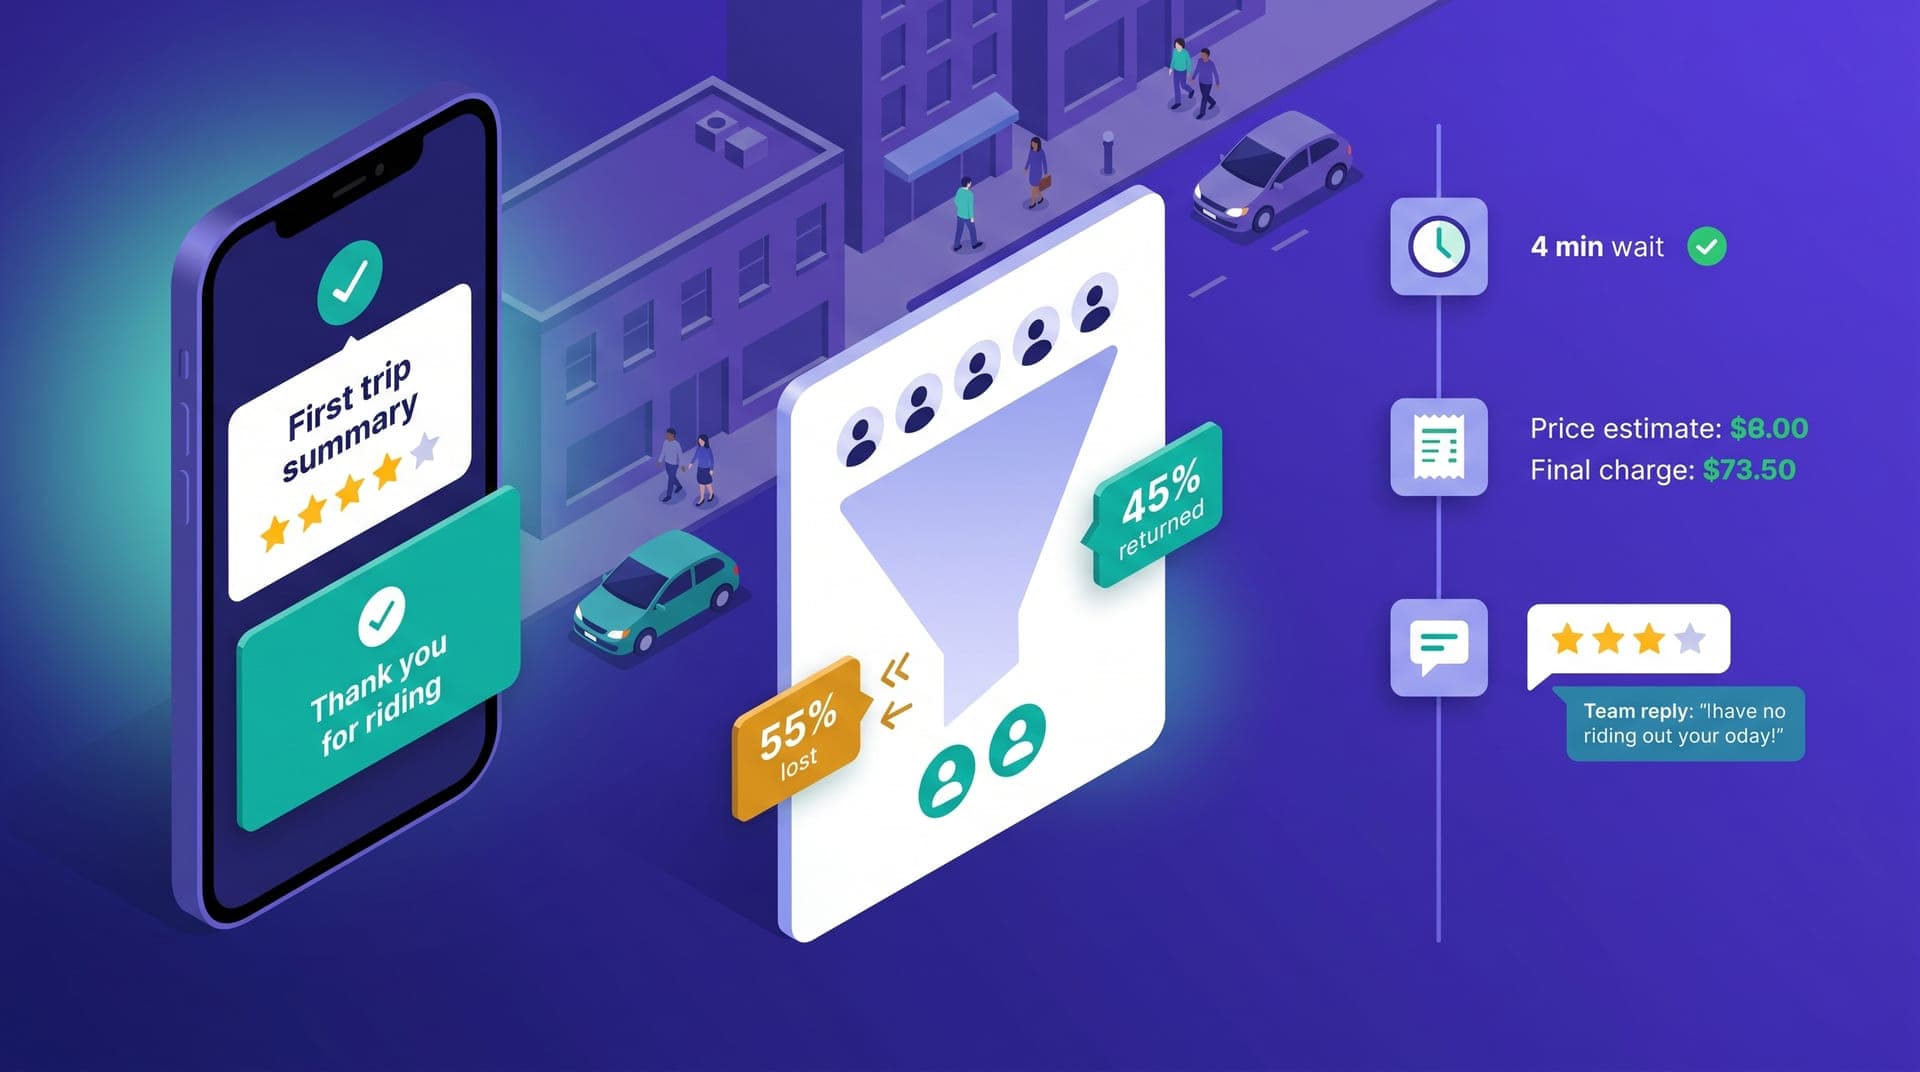
The operator who invests in service quality — verified drivers, maintained fleet, response times within target — typically assumes that's enough to build an active and growing passenger base. Regional operation data from LATAM tells a different story: between 45 and 60 percent of passengers who complete their first trip on a local platform don't take a second one within the following 30 days. That number doesn't indicate the service was bad — it indicates there was no active reason to return. The gap between a first trip and a usage habit doesn't close by itself, and it doesn't close through more advertising either: it requires understanding where the new passenger is lost and which specific actions shift that probability within the first week after the initial contact.
This article is for operators with an active operation who know how many new users they acquire per month but aren't measuring what percentage of those users takes a second trip within the following 7 days and a third within the next 30. Passenger retention in that early window is the most predictive metric of whether the operation is building a durable user base or staying in a permanent acquisition cycle to compensate for users who don't return. The operator who reduces churn in the first 30 days doesn't just improve the return on their acquisition investment — they build the user base that no external competitor can take away with a month of discounts.
The first trip as a real-time diagnostic of your operation
The first trip of a new passenger is the only moment they have no calibrated expectations about your platform. They don't know exactly how long they'll wait, how the driver will behave, or whether the final price will precisely match the estimate they saw before confirming. That uncertainty amplifies both positive and negative experiences: a first trip that exceeds expectations generates a probability of a second trip two to three times higher than the fleet average; a first trip that disappoints at any friction point — however small the incident — carries a permanent abandonment rate of between 50 and 70 percent. The passenger doesn't need a terrible experience to not return: an indifferent one in a context where they have other options available is enough.
The most common friction points in the first trip are rarely the ones the operator monitors most closely. The time between the request and having a driver visibly assigned in the app is the leading cause of pre-trip cancellation: if it exceeds 4 minutes during normal hours in a city of under 250,000 people, the request cancellation rate rises 25 to 40 percent above average. The gap between the estimated price at confirmation and the final price charged is the second most frequent post-trip friction point: in normal conditions, a difference above 10 to 12 percent causes discomfort even when the absolute amount is small. The third is the driver's behavior in the first 90 seconds of the trip — destination confirmation, vehicle condition, visible phone use — which sets the tone for the entire interaction. Those three factors account for most of the churn after a first trip with no serious incident.
The 7-day window: what sets apart the passenger who returns
In operations that track per-user behavior from the first week, there is a consistent pattern separating passengers who become regulars from those who don't return: the regular passenger takes a second trip within the first 7 days of the first one, frequently in the same need context — the same route, the same time window, or a trip related to the original. The passenger who doesn't return within 7 days has a return probability over the following 30 days of only 30 to 40 percent. The one who doesn't return within 30 days has a return probability over the following 90 days below 15 percent. The active retention window is narrow: if the operator does nothing in the 7 days following the first trip, the probability of that passenger becoming a regular user drops by half.
What determines whether the passenger takes that second trip in the first week isn't always the quality of the first trip — sometimes it's whether the operator gave them an active reason to return. A passenger who had a correct first trip but no follow-up has to remember on their own that the app exists the next time they need transport. A passenger who had a correct first trip and received some useful communication in the hours that followed — trip confirmation, personalized welcome, or a direct channel for any questions — has more recall triggers pulling them back before they need to look for another option. The difference between the two scenarios isn't in the first trip: it's in what the operator does in the following 48 to 72 hours.
The three moments where the operator loses the new passenger
New passenger churn concentrates in three specific moments of the first-trip cycle. Each has different causes and different interventions, and all three can occur in the same trip or in different combinations depending on the passenger profile and the operation's conditions that day:
- During the assignment wait: when the time between request and a visible driver assignment exceeds 4 minutes with no status update on screen, the request cancellation rate rises 25 to 40 percent above average. The solution isn't always more drivers — sometimes it's communicating the search process more clearly on the waiting screen so the new passenger understands the system is active and looking, not that there is no coverage in their zone.
- At trip close: a gap above 10 to 12 percent between the estimated price at confirmation and the final price charged creates post-trip friction the passenger rarely communicates formally but does register as a reason not to return. The same applies to routes significantly longer than the direct option with no driver explanation during the trip, which the passenger reads as poor judgment or intentional overcharging.
- In the 24 to 72 hours post-trip: the passenger who rated their first trip 3 stars or lower and received no contact from the team within the following 48 hours has a return probability below 18 percent over the next 30 days. Not responding to a low rating is the omission error with the highest impact on new passenger retention — and the easiest one to correct.
Why the second-trip discount doesn't solve churn
The most common response when an operator detects new passenger churn is a second-trip discount: a 15 or 20 percent code sent to passengers who haven't returned in 7 days. The instrument has a structural problem: it attracts the price-sensitive passenger, who comes back to use the discount and returns to churn once it ends, and it doesn't attract the passenger who left because the first trip generated a perception of insufficient quality. That passenger has a reason for not returning that the discount doesn't address: if they waited 6 minutes and interpreted that as low coverage, the discount doesn't tell them that wait times will be better now; if they paid more than estimated, the discount doesn't explain why it happened or that it won't repeat. Discounts as a mass retention tool have low ROI when the post-first-trip churn rate exceeds 40 percent, because most of that churn has experience-driven causes, not price-driven ones.
The correct use of discounts in passenger retention is not as a general reactivation tool — it is as a specific tool for an identified segment: the passenger who had a first trip with documented friction and who shows a pattern of frequent transport need based on the context of that first request. Offering a discount as part of a personalized recovery conversation — acknowledging the specific problem that occurred — converts two to three times better than the same discount sent as a mass message to everyone who didn't return in 7 days. The difference is that the personalized version addresses the actual reason for abandonment, while the mass version only reduces price friction for passengers who didn't leave because of price.
How to measure passenger retention without a data team
The most important metric for measuring new passenger retention doesn't require a data team: it's the percentage of new users who complete a second trip within 7 days of the first. That metric, calculated weekly for each week's cohort of new users, quickly reveals whether the operation has a systemic retention problem or whether churn concentrates in specific segments — by origin zone of the first trip, by time window, by assigned driver. An operator with 40 to 100 new users per week can do that tracking in a spreadsheet: list the user IDs of new signups from that week, flag which ones took a second trip within the following 7 days, and calculate the percentage week over week. No sophisticated analytics platform is needed for that visibility — just the habit of measuring it.
The two complementary indicators that give context to that primary metric are: the percentage of new passengers who rate the first trip 4 or more stars — the best predictor of a second trip the operator can capture in real time —, and the percentage of low ratings (3 stars or fewer) that receive a team response within the following 48 hours. Those three metrics together — 7-day second-trip rate, first-trip positive rating rate, and low-rating response rate — give the operator a complete picture of where the retention problem lies without needing complex behavioral analytics. The operator who tracks those three variables has enough information to identify whether the problem is in the first-trip experience, in post-trip follow-up, or in both.
The interventions with the best track record for new passenger retention
The interventions with the best track record in regional LATAM operations are not the most expensive or the most technologically complex. They are the ones that directly address the documented causes of post-first-trip churn with the least operational overhead for the team:
- Personalized team response to 3-star or lower ratings within 24 hours: a message that references the specific problem noted in the comment — not a generic apology — generates a second-trip rate two to three times higher than no response.
- Welcome message via WhatsApp within two hours of the first trip: brief, with the passenger's name, confirmation of the completed trip, and a direct channel for any questions. It's not marketing — it's confirmation that a real operation exists behind the app.
- Proactive communication when wait time exceeded 5 minutes on the first trip: a message acknowledging the wait, without automatic excuses or discounts, retains better than total silence. The passenger who waited knows they waited — the operator who acknowledges it shows they know it too.
- Follow-up on the well-rated driver from the first trip: if the first trip received 4 or more stars and the driver is still active, making the option to request that driver again visible to the passenger has documented impact on usage frequency in the following weeks.
- Availability communication for the passenger's usual zone and time window, three to five days after the first trip: not a discount, but contextual information reminding them the platform is available in that specific moment and place. Contextual reminders outperform generic activation messages in converting to a second trip.
Before, we measured how many new users registered each week. Now we measure how many of those users take a second trip in the following 7 days. When we shifted focus to that metric, we discovered we were losing 58 percent of new users in that first week. We started responding to all 3-star or lower ratings the same day, and sending a WhatsApp message to every new user within two hours of their first trip. In three months, the 7-day second-trip rate went from 42 to 61 percent. We didn't change the service — we changed what we did in the 48 hours after the first trip.
Passenger retention after the first trip is not a marketing problem — it's an operations problem. A first trip within expected wait times, with a price consistent with the estimate and a driver whose behavior met the service standard, has a naturally higher return rate than one with friction at any of those points. The operator who knows the specific friction points of their operation — measured by zone, by time window, by driver, or by trip type — has all the information they need to direct their improvement investment toward where it produces the greatest retention impact, without needing to cut prices or invest more in new user acquisition. Retention starts in the operational quality of the first trip, not in the message sent two days later.
The regional operator with a 7-day second-trip rate above 55 percent is building something more valuable than a large user base: they're building a user base that reaches for the platform as their first option. That base has a much lower effective acquisition cost than one built through discount cycles, because natural retention reduces the need for constant new user investment to maintain active volume. In a city of 200,000 to 400,000 people, the operator who has 20 percent of the potential user base with high-frequency usage holds a stronger and more profitable market position than the operator who has 35 percent with sporadic use. The difference isn't in how many new users register each week — it's in how many of those already registered return to use the platform without anyone reminding them.