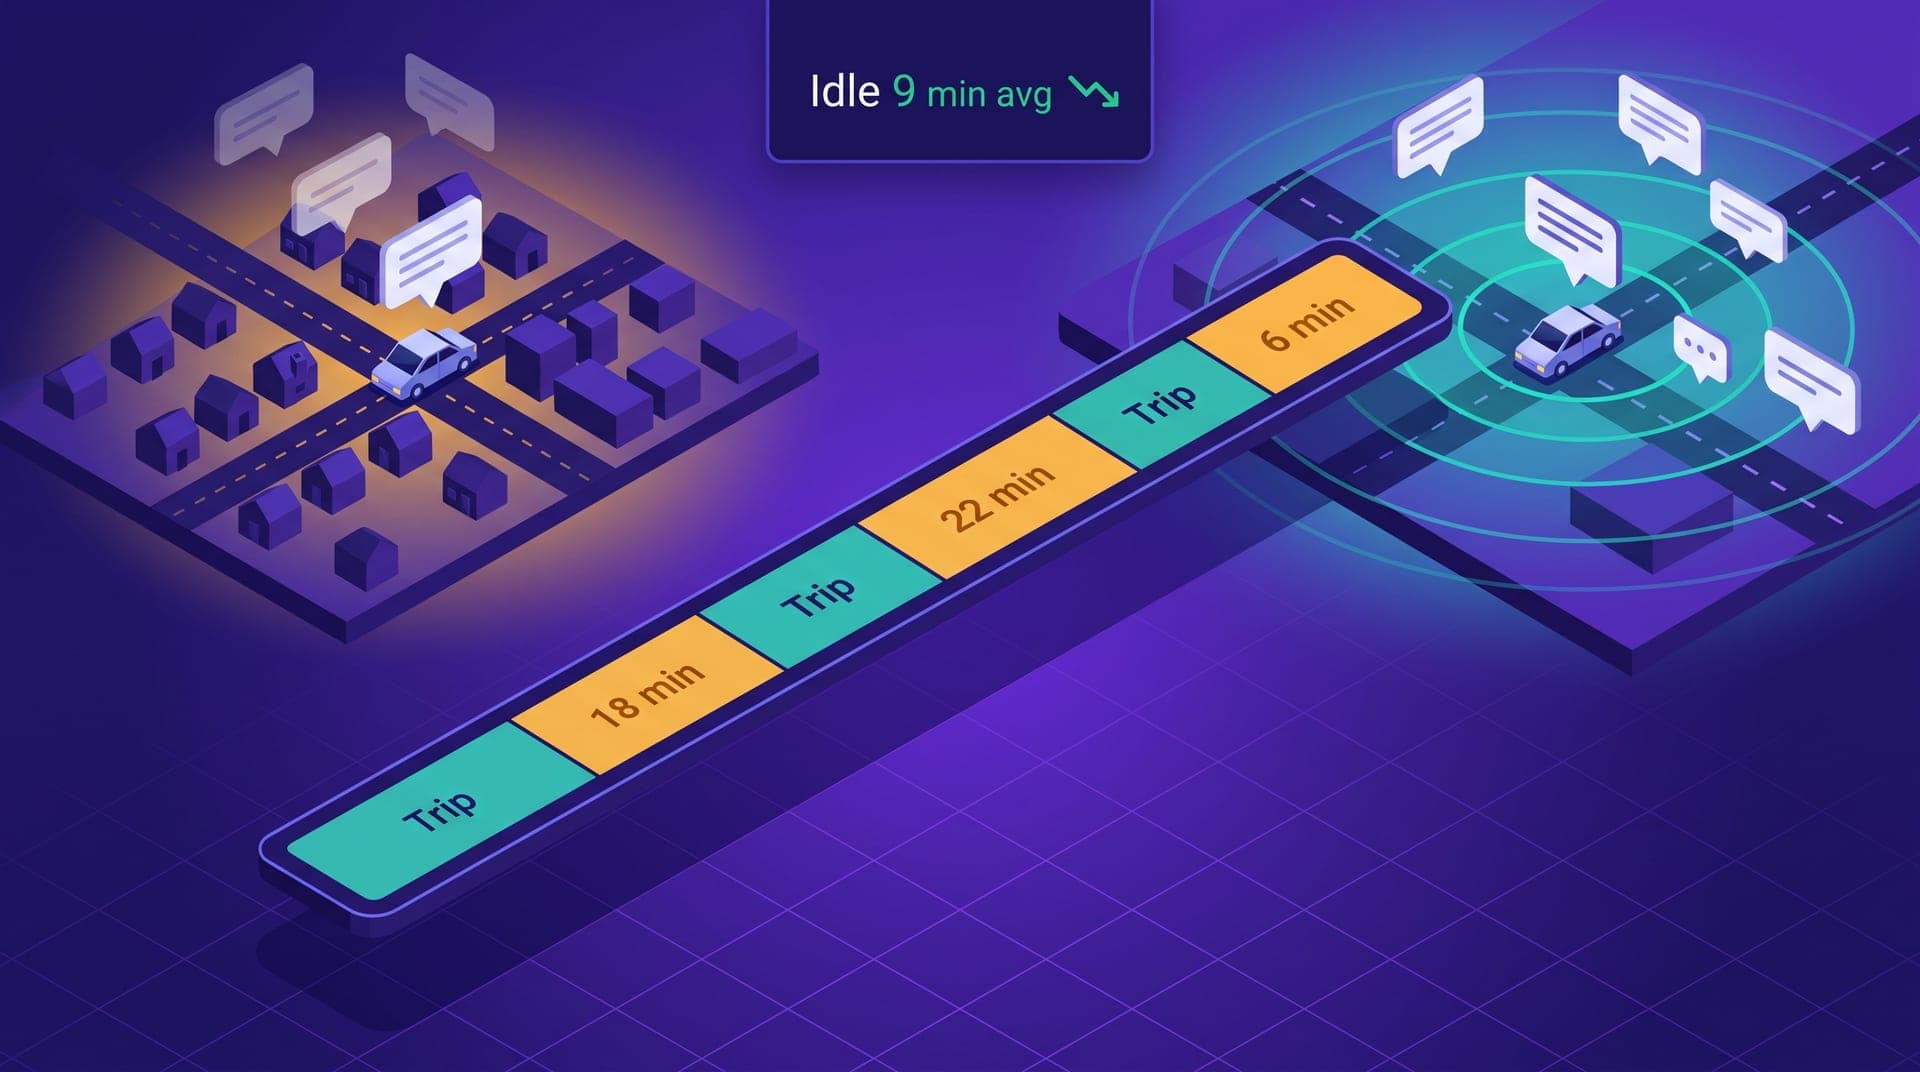
Idle time between trips — the minutes a driver spends connected without completing or receiving a request — is the variable with the most weight in the empirical evaluation every driver makes of whether your platform is worth their shift. Not the commission, not the base fare, not the session bonus design. A driver who works four hours and completes eight trips has a qualitatively different session experience than one who works four hours and completes four, even if the final income is comparable. The difference is not in the total at the end of the shift: it is in how those four hours felt — productive and continuous, or fragmented by waits that drain the motivation to stay connected. That perception, accumulated over three or four weeks, determines whether your driver concludes that your platform is their primary option or one they supplement with another that produces less idle time.
This article is for the operator who observes driver churn without a clear cause in fare or commission, or who sees long connection sessions but low hourly productivity across their fleet, and wants to understand idle time as a measurable operational variable. It covers why idle time has more weight than the fare in the driver's platform evaluation, how to measure it from available data, which zones and time slots concentrate it and why, how its accumulation produces the multi-platform behavior that raises passenger wait times, what operational design decisions reduce it without additional investment, and how the agent identifies where the problem lies before it manifests as churn.
Why idle time outweighs the fare in the driver's platform evaluation
A driver evaluates a platform through two metrics they rarely articulate explicitly but which guide their session decisions: income per effective hour and quality of the waiting experience. The first is quantifiable — the driver can compare how much they earned over four hours on platform A versus platform B. The second is diffuse but more determinant in the short term: a driver who waits an average of 18 minutes between trips experiences those four hours radically differently from one who waits 6, even if final income is similar. Perceived idle time affects tomorrow's motivation to connect, and that cumulative effect week over week is what produces churn the operator cannot explain by looking at the fare alone.
The fare, by contrast, is an abstract comparison factor. A driver who hears that another platform pays 10% more per kilometer doesn't immediately leave theirs if the session experience is good. But a driver who waits 15 minutes between trips on yours and observes the competitor averages 7 will naturally prioritize the competitor over the following weeks — not as a deliberate decision but as empirical adaptation that consolidates without the driver explicitly planning it. The operator who measures idle time has access to an indicator that anticipates that migration before it manifests as churn or reduced availability.
How to measure actual idle time in your operation
A session's idle time is the difference between the driver's total connected time and their active time — the sum of completed trip time plus pickup displacement time. A driver connected for four hours who completed six trips with a 12-minute average duration and 5-minute average pickup displacement had 102 minutes of active work, meaning 138 minutes of idle time in a four-hour session. That 57% idle time doesn't always produce negative perception if the waiting periods are short — twelve 11-minute waits produce a better experience than four 34-minute waits, even if total idle time is the same. Distribution matters as much as the total.
Three concrete indicators to begin measuring idle time: median idle time per session — not the average, which is distorted by atypical sessions —, maximum continuous idle time per session — the longest wait without a request —, and the percentage of sessions where that maximum exceeds 20 to 25 minutes. If more than 30% of sessions in a week include a continuous wait of over 20 minutes, the pattern is structural. Maximum continuous idle time is the indicator most correlated with driver frustration: a session that included a 35-minute uninterrupted wait is remembered as a bad session even if all other intervals were acceptable.
The zones and time slots that concentrate idle time and why
Idle time doesn't distribute evenly: it concentrates in zones with low request density and in intermediate demand slots where there's enough activity to keep drivers connected but not enough to keep them continuously occupied. In regional markets, residential zones far from the main commercial corridor typically have the highest idle time — a driver who drops off a passenger there after a trip can wait 15 to 25 minutes for the next request if demand flow in that zone doesn't justify their position. Intermediate demand slots — 10 a.m. to 1 p.m. and 2 to 4 p.m. in most cities — produce the most accumulated idle time: demand drops enough that the ratio of requests to active drivers falls below 0.5 per hour, meaning there are more connected drivers than demand can keep productively occupied.
How accumulated idle time produces multi-platform behavior
Accumulated idle time on your platform is the mechanism that produces multi-platform behavior: a driver who waits an average of 14 minutes between trips on your app but observes that the competitor averages 7 has a rational incentive to keep both apps active. They do it not out of disloyalty — they do it because maximizing their exposure to requests from multiple sources is the practical strategy that best protects their session income in a market where no single platform generates continuous volume. The critical threshold appears to be around 10 to 12 minutes of continuous idle time: above that point, the behavior of opening a second app activates systematically in the first three weeks of operation. Below it, the friction of managing two apps — cross-cancellations, double-assignment risk — makes keeping one app more convenient than the marginal benefit of the second.
The operational consequence of that threshold is that idle time doesn't relate linearly to multi-platform behavior: reducing it by 20% doesn't reduce multi-platform usage by 20%. The effect is threshold-based — moving from 14 minutes average idle time to 9 produces a more significant behavior change than moving from 24 to 19. That threshold behavior means there is a specific operational investment point where reducing idle time yields the highest return in effective availability: it's not about minimizing it indefinitely but about crossing below the point where a second app stops being rationally attractive to the driver.
I had drivers who would connect for three hours and disappear. Average income wasn't bad — I assumed it was a motivation issue or direct competition. When I asked the agent to show time between trips per driver in their last sessions before going dark, the data was clear: most of them had 18-to-25-minute waits for more than half their session. It wasn't lack of motivation — waiting forty minutes without a request in a three-hour session didn't compete well against another platform where the same drivers told me work flowed. We adjusted the retention zones and brought median idle time from 17 to 8 minutes over six weeks. That adjustment reduced churn more than any commission change we had made before.
Three operational decisions that reduce idle time without additional cost
The first decision is retention zone management: rather than letting drivers position themselves wherever they dropped off their last passenger, the system can suggest waiting zones with higher next-request probability. In cities with known demand patterns — commercial zones in the morning, residential in the afternoon, entertainment at night — post-trip repositioning suggestions can reduce idle time by 20 to 35% in the first 60 days. A driver who follows the suggestion receives the next request faster and empirically develops the perception that connecting to your platform produces continuous sessions. The second is active communication about productive time slots: if the 10 a.m. to 1 p.m. slot has twice the idle time of the 7 to 10 a.m. slot, informing drivers when connecting yields higher returns reduces the number connected during low-demand hours and raises the requests-per-available-driver ratio in those slots without adding any cost.
The third decision is strict proximity-based assignment sequencing during high-demand slots: ensuring the closest driver to the pickup point always receives the request first reduces displacement time, frees the driver sooner for the next assignment, and increases completed trips per session. In operations where assignment prioritizes factors other than proximity — cumulative rating, uninterrupted connection time — the longer displacement raises net idle time because the driver travels without generating income during the approach. Strict proximity is not always the only reasonable criterion, but during demand peaks it has the greatest impact on perceived idle time and on session productivity for the driver.
The five idle time indicators worth reviewing every week:
- **Median idle time per session**: alert threshold when it exceeds 12 to 14 minutes during periods of high declared availability. Above that range, the driver's experience begins to deteriorate perceptibly.
- **Maximum continuous idle time per session**: when it regularly exceeds 20 to 25 minutes, the session produces qualitatively demotivating waiting episodes, regardless of total shift income.
- **Percentage of sessions with maximum idle time above 20 minutes**: if more than 30% of the week's sessions show that pattern, the problem is structural and won't be resolved with fare adjustments or additional bonuses.
- **Median idle time by zone after the last completed trip**: identifies which zones accumulate the most waiting time. A driver who drops off passengers in low-request-flow zones accumulates idle time that wouldn't exist in high-demand-density zones.
- **Median idle time variation across time slots**: if idle time in the 10 a.m. to 1 p.m. slot is three times higher than in the 7 to 10 a.m. slot, there are too many connected drivers for the request volume that slot produces.
How the agent identifies idle time and prioritizes intervention zones
The agent instruction to diagnose idle time: 'For drivers who completed more than three sessions this week, show me the median time between requests per session and by delivery zone from recent trips. Are there zones where median idle time exceeds 15 minutes in more than 40% of sessions? Which ones, and in which time slots does this occur?' That query surfaces the high idle time zones the standard dashboard doesn't expose — the operator sees how many trips each driver completed, but typically doesn't see how many minutes they waited between each one or from which position. The high-wait zone pattern, crossed with low demand in the same zone and time slot, identifies exactly where repositioning suggestions carry the highest return on fleet idle time.
A second predictive churn query: 'For drivers who completed more than three sessions over the last four weeks and dropped to fewer than two this week, what was the median idle time in their last two active sessions? Is it higher than the fleet average?' If drivers who are reducing their activity have significantly higher idle times than the median, idle time is likely a factor in that reduction — an early warning signal before it manifests as reduced availability or complete disconnection. The follow-up query four weeks after adjusting retention zones: 'Compare median idle time per session this week against the four weeks before the adjustment. In which zones did it drop the most? Did drivers in those zones complete more trips per session?' That pair of readings turns idle time into a data-managed variable rather than an invisible symptom that surfaces as unexplained churn.
Idle time between trips doesn't appear in the standard dashboard of most regional platforms. The operator sees completed trips, total income, and active drivers, but rarely sees how many minutes each driver spent waiting silently between one request and the next. That invisibility is why the problem gets diagnosed late, after it has already manifested as fleet churn, elevated multi-platform behavior, or availability lower than expected — symptoms whose cause the operator typically searches for in fare, commission, or competition without first measuring the session experience their current operational design produces.
The operator who adds median idle time per session as a regular indicator in their weekly review gains access to a lever that no bonus program can replicate: the quality of each driver's working experience in every shift. When that indicator is low, retention and availability concentration take care of themselves. When it is high, the right adjustment is not raising the fare or lowering the commission — it is identifying which zones and time slots concentrate idle time, managing repositioning and fleet balance by hour, and actively communicating to drivers when and where connecting produces sessions worth completing.