In regional ride-hailing markets across Mexico and Central America, a significant share of fleets operates under the shared-shift model: the same vehicle has two registered drivers alternating shifts — day and night — covering 16 to 20 daily operating hours. This model, inherited from traditional taxi culture and economically efficient for the vehicle owner, accounts for 30 to 60% of vehicles in many regional fleets. When an operator migrates that fleet to a ride-hailing platform, they face an immediate friction: the platform assigns trips and measures performance at the driver level, but the fleet is structured at the vehicle level. The result is a systematic measurement problem: the average trips, ratings, and cancellation rate showing per vehicle blends the performance of two different drivers without distinguishing when each worked or under what demand conditions their shift operated.
This article is for operators with 15 to 60 vehicles in their fleet where 30% or more operate under a shared-shift arrangement, without a differentiated process for coordinating shift handoffs, measuring performance at the driver level rather than the vehicle level, or designing incentives that work for two distinct profiles sharing the same asset. It covers the two economic models of shared shifts in LATAM — fixed daily rental and revenue split — and their implications for driver behavior on the platform; how to structure driver registration so performance data is attributable to the right person; what shift handoff protocol reduces coverage gaps during driver changeover; how to design incentives that work for both full-time and part-time profiles sharing the same vehicle; and what agent query produces the diagnostic that separates driver performance from shift timing. The thesis is direct: the shared-shift model is not a degraded version of the single-driver model — it is a fleet structure with its own economic logic, and managing it as if it were a single-driver model produces measurement errors that lead to wrong conclusions.
The two economic models of shared shifts: fixed rental and revenue split
The fixed daily rental model is the most common in markets where the owner-operator taxi culture is established. The vehicle owner charges the driver a fixed amount to operate the car during their shift — in regional operations in Mexico, that amount ranges from 250 to 450 MXN per 8-to-10-hour shift, regardless of how many trips are completed. The driver keeps all income generated above that rental. For the owner, the advantage is certainty: they receive their daily income regardless of whether demand was high or low. For the driver, the operational implication is a psychological break-even point: they need to generate at least the rental amount before they start earning. A driver with a 350 MXN rental working at an average fare of 75 MXN needs to complete 4 to 5 trips just to break even — and this shapes their behavior in the first hours of the shift: high pressure to complete trips quickly, lower tolerance for waiting between requests, and a tendency to reject long trips that would take the driver away from high-density zones.
The revenue-split model divides collected fares between the driver and vehicle owner at an agreed ratio — typically 65/35 or 70/30 in favor of the driver. Unlike the fixed rental, both parties' income scales with trip volume, which better aligns incentives: the owner also benefits when the driver completes more trips, and the driver faces no fixed break-even pressure. Driver behavior under revenue split tends to be more conservative: without the urgency of covering a rental, there is less pressure in the first hours and more willingness to accept trips of any distance. For the platform operator, the revenue-split model produces a more stable but potentially less intensive activity pattern than the fixed rental. In markets where the operator controls which model their affiliates use, revenue split performs better on weekends and high-demand nights — when the driver has time to complete the volume that makes the model viable for both parties. Fixed rental performs better in high-density daytime blocks where the driver can easily surpass break-even in the first 2 to 3 hours of the shift.
The problem with measuring performance by vehicle instead of by driver
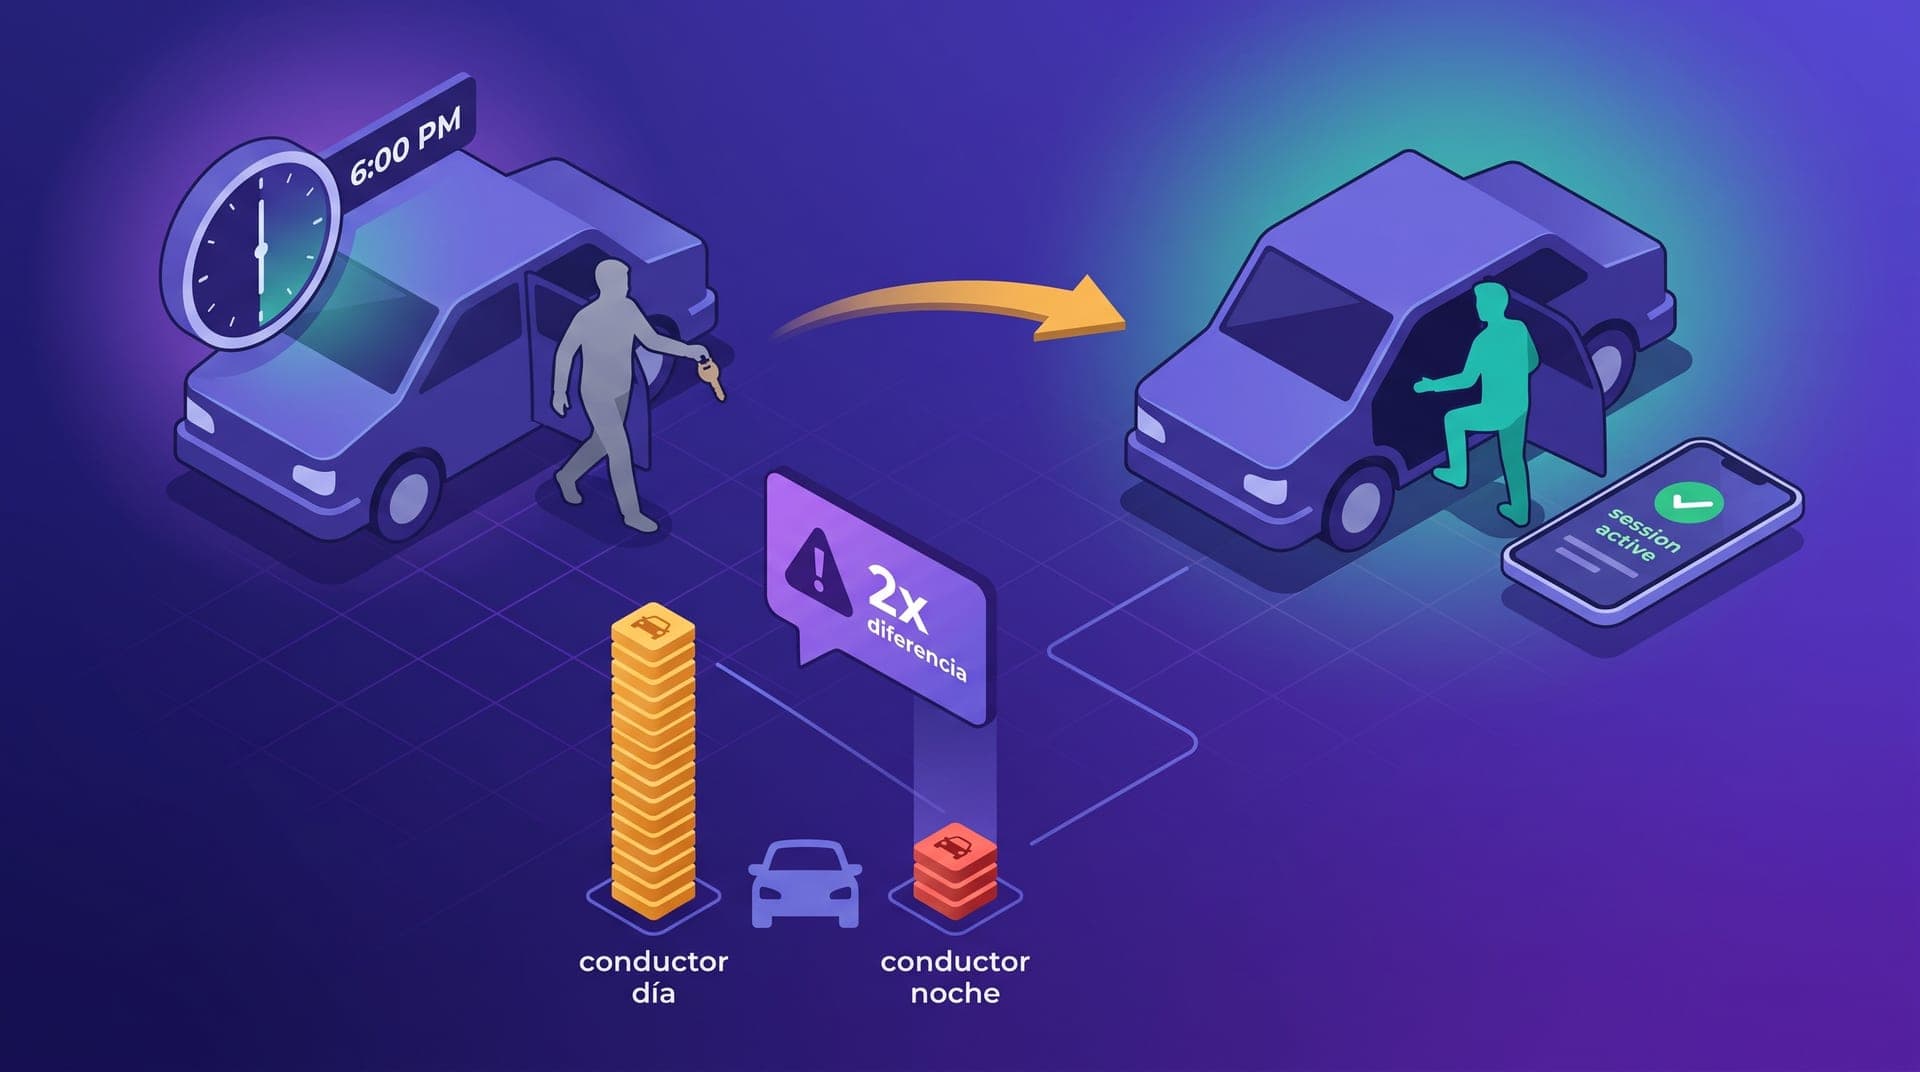
When a shared vehicle records 9 trips in a day with a 4.4-star average rating, that figure is operationally useless for the operator. It doesn't indicate how many trips the day-shift driver completed versus the night-shift driver. It doesn't reveal whether the 4.4 average results from one driver rated 4.8 and another rated 4.0, or whether both independently hovered around 4.4. It also doesn't show whether the cancellation rate was uniform across shifts or whether one driver systematically rejected trips the other would have accepted. In a fleet of 40 vehicles where 18 operate under shared shifts, that aggregation problem can hide 4 to 6 individual drivers with problematic performance inside vehicles that look normal on the dashboard average. The operator who acts on vehicle-level averages never identifies the specific driver who needs attention; and the high-performing driver of the same vehicle pays the cost of that ambiguity: receiving less recognition and fewer differentiated incentives than they should.
The technical solution is simple but requires operational discipline: every driver must be registered individually on the platform with their own profile, and every shift must begin with an explicit login — the driver activates their shift from their own profile, not from the vehicle profile or the partner-owner's profile. With that registration in place, all trips and ratings during the session are attributed to the driver who was active at that moment. The vehicle dashboard can still display the consolidated view — useful for the asset owner — but the operator has access to individual driver-level data. In operations that implement this protocol, the initial setup time is 15 to 30 minutes per driver pair. The differential information it produces — performance comparison between day and night shift of the same vehicle, identification of rating gaps, cancellation diagnosis per specific driver — is the foundation for all management decisions that shared-shift operations require.
The handoff protocol: the coverage gaps nobody measures
The most vulnerable moment in a shared-shift operation is not the demand peak or the late evening: it is the shift handoff. In a fleet where the day shift ends at 6 PM and the night shift starts at 7 PM, there is a 60-minute gap where the vehicle is physically available but no active driver has it. Across 40 shared-shift vehicles, that can mean up to 40 vehicles simultaneously out of coverage during the first hour of the afternoon — exactly when demand begins rising toward its evening peak. That gap doesn't always appear as 'vehicle inactive' on the dashboard if the outgoing driver doesn't log out before handing over the keys — a frequent operational error — which generates incorrect trip attribution to the wrong shift and confuses the performance diagnostic.
The four elements of the shift handoff protocol that reduce coverage gaps in a shared-shift operation:
- **Mandatory logout before handoff**: the outgoing driver closes their platform session before handing over the keys. Without this step, trips from the incoming driver's shift are attributed to the outgoing driver's profile, mixing performance data from both shifts in the same record.
- **Immediate login by the incoming driver**: the night driver activates their profile before leaving the handoff point. The vehicle reappears in coverage from the first minute of the new shift, not after the driver arrives at the demand zone.
- **Quick vehicle check at shift start**: fuel level, app status, and any mechanical incident. If the vehicle has issues affecting operation, the incoming driver notifies the operator at that moment — not after losing the first demand block.
- **Night-shift starting zone communicated 30 minutes in advance**: the operator sends the initial positioning instruction to the night driver before shift start so they go directly to the highest request-density zone, instead of starting at the handoff point which may be far from the evening demand corridor.
Incentives for two distinct profiles sharing the same asset
The most common error in incentive design for shared-shift fleets is applying the same bonus to both drivers of the same vehicle. An incentive for 'complete 15 trips today and earn 120 MXN' works reasonably well for the day driver with a 10-hour shift and strong demand from 8 AM. It doesn't work for the night driver who starts at 6 PM and has a 5-hour shift, with demand concentrated in two blocks — 7 PM to 9 PM and 10 PM to 1 AM — separated by a mid-evening valley of lower request density. With that pattern, 15 trips in 5 hours require a 3-trip-per-hour completion rate during high-demand blocks, achievable but demanding. Many night drivers cannot reach that target within their available effective time, which means the incentive doesn't activate the desired behavior — staying connected longer — but instead produces frustration at the end of the shift.
The minimum viable fare in shared-shift operations
In a shared-shift operation, the minimum viable fare has an additional constraint that the single-driver model doesn't have: the vehicle must generate enough income for both the day and night drivers to earn a reasonable amount during their shift, after covering the rental or owner payment. If the minimum net daily income for the day driver is 550 MXN after rental and for the night driver 350 MXN net, and the total rental paid to the owner sums to 600 MXN across both shifts, the vehicle needs to generate at least 1,500 MXN in gross trip fares per day. At an average fare of 85 MXN, that means 18 trips per day. Distributed across 18 active operating hours, that is exactly 1 trip per active hour — a low bar that the operator can verify whether it is currently being met.
The risk appears when the base fare is too low to support that equilibrium. If the average fare drops to 65 MXN because the operator lowered the minimum trip fare to win conversion against competition, the vehicle needs 23 daily trips to sustain the same net income level for both drivers. That difference of 5 extra trips spread across 18 hours may seem small, but in a 5-hour night shift that already operates in blocks with low request density between 9 PM and 10 PM, generating 2 to 3 additional trips means the night driver must extend their shift or accept trips that take them out of their preferred zone. When the model doesn't close economically for the night driver, the most common outcome is that driver starts failing at shift start — arriving 30 to 60 minutes late, creating the handoff coverage gap and reducing the vehicle's total income — or simply abandons the shared-shift arrangement within the first 60 days.
The agent query that separates driver performance from shift timing
The agent query that produces the differential performance diagnostic by driver in shared-shift fleets: 'For vehicles in my fleet with two registered drivers, show me for the last 30 days the average trips per active hour, average rating, and cancellation rate for each driver individually. For each vehicle, flag cases where the two drivers have a difference greater than 1.5 points in average rating, more than 40% difference in trips per active hour, or where one driver's cancellation rate exceeds the other's by more than 10 percentage points. Also identify vehicles where there were more than two 60-minute windows in which neither driver had an active session during the 6 PM to 9 PM or 7 AM to 10 AM blocks in the last 14 days.' That query produces two critical results: the list of drivers with significantly different performance from the shift partner in the same vehicle, and the map of coverage gaps in the handoff blocks.
The complementary query that calibrates whether the night shift of shared vehicles is capturing its demand potential: 'For vehicles with two drivers, compare the income per active hour of the night-shift driver — shift from 6 PM onward — with the income per active hour of single-driver vehicles' night-shift drivers operating in the same time window and similar zones. If the shared-vehicle night driver has a per-active-hour income more than 20% below the average of solo night drivers, identify which zones that driver operated in during the 7 PM to 10 PM blocks.' That result determines whether the shared-vehicle night driver's performance gap is behavioral — they cancel more, work fewer active hours — or positional — they operate in zones with less demand at that time. The first requires a conversation with the driver; the second requires a different positioning instruction for the night shift.
I had 22 vehicles in my fleet and thought 8 were performing well based on the daily vehicle-level trip averages. When I started separating by driver, I found that in 5 of those 8 vehicles the night driver was making fewer than 3 trips in a 5-hour shift. The day driver was completing 12 or 14; the night driver, 2 or 3. The vehicle average looked acceptable. When I spoke with the night drivers of those 5 vehicles, three told me there were no trips in the zones where they operated after 10 PM. I adjusted the night positioning toward bar and restaurant corridors and sent the zone instruction at shift start. In six weeks the nightly income from those 5 vehicles went up between 32 and 47%.
Shared shifts are not a management problem: they are a fleet structure that generates higher asset utilization per vehicle than the single-driver model when managed correctly. A vehicle operating 18 to 20 hours per day with two drivers generates 50 to 70% more trips than the same vehicle driven by a single part-time driver, and the owner has better daily income certainty. The management challenge is not the model itself but the measurement gap: a platform that aggregates performance at the vehicle level instead of the driver level produces an average that makes the driver who needs attention invisible. Once that gap is closed with individual driver registration, per-shift login protocols, and differentiated agent queries, shared shifts actually offer more improvement levers than the single-driver model: it becomes possible to intervene in the day shift without affecting the night shift, compare performance within the same asset, and identify whether the problem is with the driver or the shift's positioning.
The two metrics that reveal whether a shared-shift fleet is being managed correctly or measured incorrectly are simple: the difference in trips per active hour between the two drivers of the same vehicle, and the presence of handoff gaps — windows where neither driver has an active session during high-demand blocks. A fleet where the performance difference between drivers of the same vehicle is under 30% in trips per active hour has both shifts with adequate demand and both drivers properly positioned. A fleet where that difference exceeds 50% has a performance or positioning problem that the vehicle-level average will never reveal. The weekly agent query that produces that comparison converts the shared-shift model from an operational blind spot into a structurally measurable and adjustable part of the operational calendar: the same review process the operator uses for rain or the quincena can incorporate the weekly shared-shift diagnostic without requiring any additional separate analysis.